16.03.2026
Common Contours #1. What do Ukrainians think about the EU? A comparison with public opinion in the EU and candidate countries

Rating Group is launching a special research project titled “Common Contours.” This is a survey exploring Ukraine in a European context, where we mirror questions and compare data from our own surveys of Ukrainians with data from other surveys conducted in EU countries, candidate countries, and other European countries.
In the first release of “Shared Contours,” discover how Ukrainians perceive the European Union compared to other European countries. This time, we compare data from our own research with Eurobarometer data — a series of official EU surveys conducted by the European Commission and the European Parliament.
Note: Eurobarometer data belongs directly to the EU, and we are grateful for open access to it.
Trust in the EU as an institution
A majority of Ukrainians trust the EU as an institution, with the level of trust being slightly higher than in some EU countries.
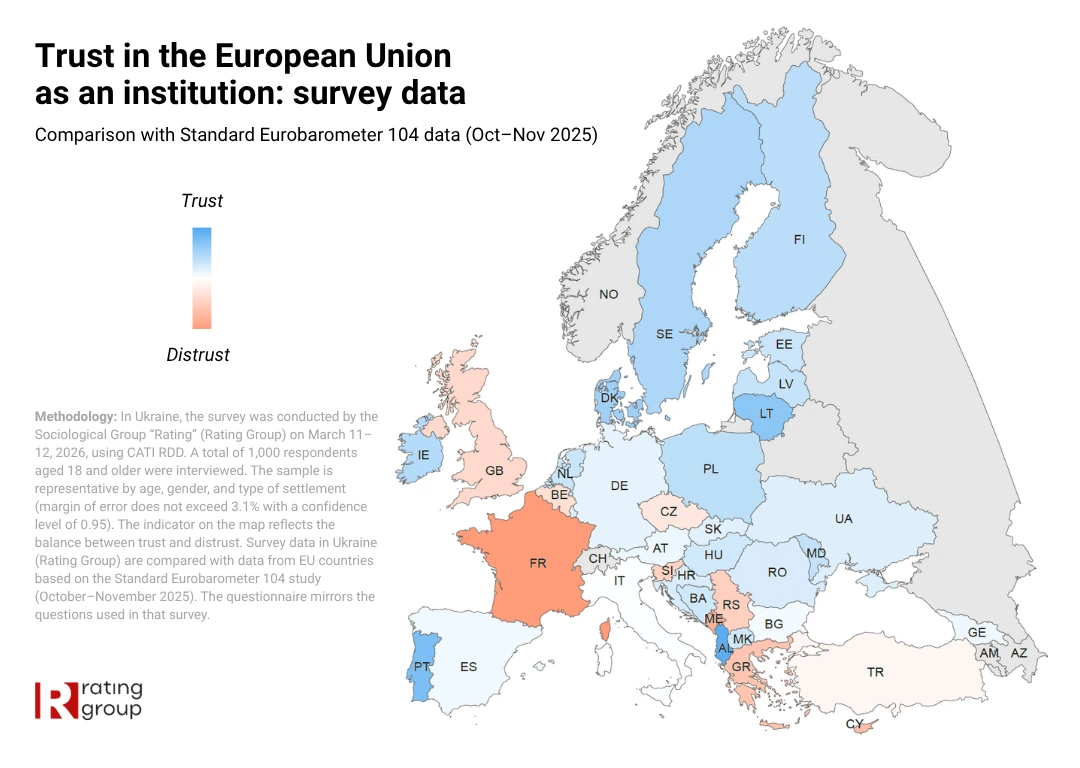
- A majority of Ukrainians trust the EU as an institution (53%), while 41% do not trust it, and another 6% remain undecided.
- In Ukraine, the level of trust in the EU is slightly higher than the average across EU countries themselves (48%).
- In particular, Ukrainians express higher levels of trust in the EU than citizens of several Western, Central, and Southern European countries, including France, Cyprus, Greece, Slovenia, Belgium, the Czech Republic, and Bulgaria.
- Among candidate countries, similar levels of trust in the EU are observed in Moldova (55%) and Bosnia and Herzegovina (56%).
Perceptions of the EU’s future
In the context of war, Ukrainians demonstrate cautious optimism about the future of the EU, along with slightly higher levels of skepticism compared to other candidate countries.
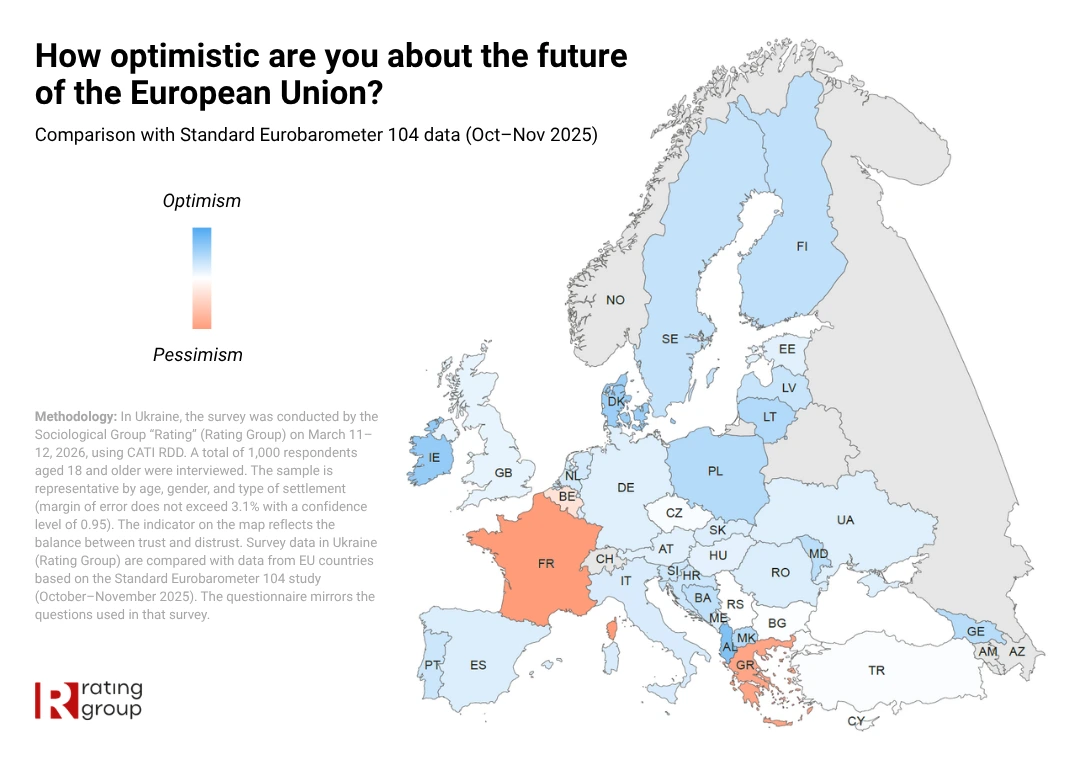
- More than half of respondents in Ukraine are optimistic about the future of the European Union (54%). At the same time, one-third of respondents (35%) hold a pessimistic view, while another 12% remain undecided.
- On average, across EU countries, 59% of respondents are optimistic, while 38% are pessimistic. In terms of the balance between positive and negative perceptions, Ukraine is fairly close to the overall European trend.
- However, Ukraine has a relatively high share of “don’t know” responses compared to most European countries (where this figure typically ranges between 1–5%).
- Among EU candidate countries, Ukraine demonstrates a relatively more restrained outlook. For example, in neighboring Moldova, 64% of respondents express optimistic views.
Emotional perception of the EU
Ukrainians follow the broader European trend of predominantly positive and neutral attitudes toward the EU.
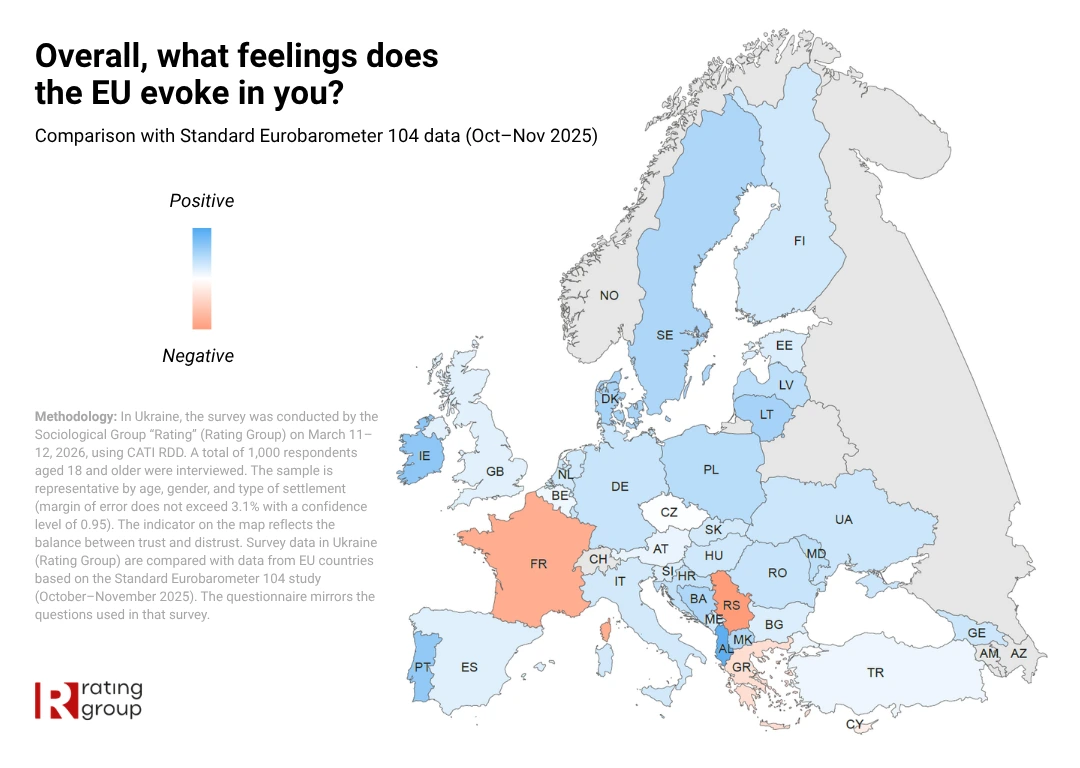
- A relative majority of Ukrainians have neutral feelings toward the EU (46%), while 40% express positive attitudes. Every tenth respondent reports a negative perception.
- In EU countries, on average, 38% report neutral feelings, 42% positive, and 19% negative. This means that in Ukraine there is a higher share of neutral perceptions, but also noticeably lower levels of negative sentiment toward the EU compared to many member states.
- Overall, in terms of the balance between positive and negative perceptions, Ukrainians align with the broader European trend.
- Compared to non-EU countries, perceptions of the EU in Ukraine are more positive than, for example, in Serbia (34%), Georgia (36%), or the United Kingdom (37% positive, but also 20% negative).
Rating Group is one of the largest research institutions in Ukraine, operating since 2008. The company is registered in Ukraine and has extensive experience in conducting sociological surveys both domestically and internationally. The group includes: Sociological Group Rating, the research laboratory Rating Lab, the platform Rating Online, and the Rating Call Center.
Methodology
- Fieldwork period: March 11–12, 2026
- Method: CATI (Computer-Assisted Telephone Interviewing) — telephone interviews conducted using computer-assisted technology
- Sample size: 1,000 respondents
- Sampling design: Random sample of mobile phone numbers (population of Ukraine aged 18 and older in all regions, except for temporarily occupied territories and areas without Ukrainian mobile network coverage at the time of the survey). The results are weighted using the latest data from the State Statistics Service of Ukraine.
- Representativeness: The sample is representative by age, gender, and type of settlement (margin of error does not exceed 3.1% with a confidence level of 0.95).
Survey data in Ukraine (Rating Group) are compared with data from EU countries based on the Standard Eurobarometer 104 study (October–November 2025). The questionnaire mirrors the questions used in that survey.
Note: In some charts, totals may not sum to 100% due to rounding (including of fractional values).
Contact form
Let's discuss your research idea
Fill in the form below, and we will contact you as soon as possible