Press releases
Search press releases

IRI Survey Shows Ukrainians Remain Optimistic About Ukraine’s Future. Results Also Show Overwhelming Support for Ukraine’s Accession to European Union Membership.
Kyiv, Ukraine – A nationwide poll conducted by the International Republican Institute’s (IRI) Center for Insights in Survey Research (CISR) shows that 78 percent of Ukrainians see their country’s future as promising and 85 percent believe their country will win the war against Russia.
“Even after four years of war, the Ukrainian people remain steadfast in the face of Russia’s unjust invasion,” said Stephen Nix, Senior Director for Europe and Eurasia at IRI.
When asked about accession to European Union (EU) Membership, 79 percent of Ukrainians stated their support for it.
“It is clear that Ukrainians desire a European-oriented future for their country,” stated Nix.
.webp)
This is the first summary report of the “Common Contours” research project by Rating Group, which includes surveys of Ukrainian population between March and June 2026. Key topics of this issue:
- How interested are Ukrainians in European politics compared to citizens of other European countries?
- How many Ukrainians would vote for joining the EU and NATO?
- Who is most supportive of the idea of joining the EU?
- How do Ukrainians assess the state of democracy in the country?
The full report also includes data from previous releases of “Common Contours” between March and June 2026.
"Common Contours" is a survey about Ukraine in a European context, where we reflect questions and compare data from our own surveys of Ukrainians with data from other surveys in EU countries, candidate countries, and other European countries. In this issue, we compare our own research data with Eurobarometer data – a series of official EU surveys from the European Commission and the European Parliament. Eurobarometer data belongs directly to the EU, and we thank them for open access to it.
How interested are Ukrainians in local, national, and European politics?
(based on April 2026 data)
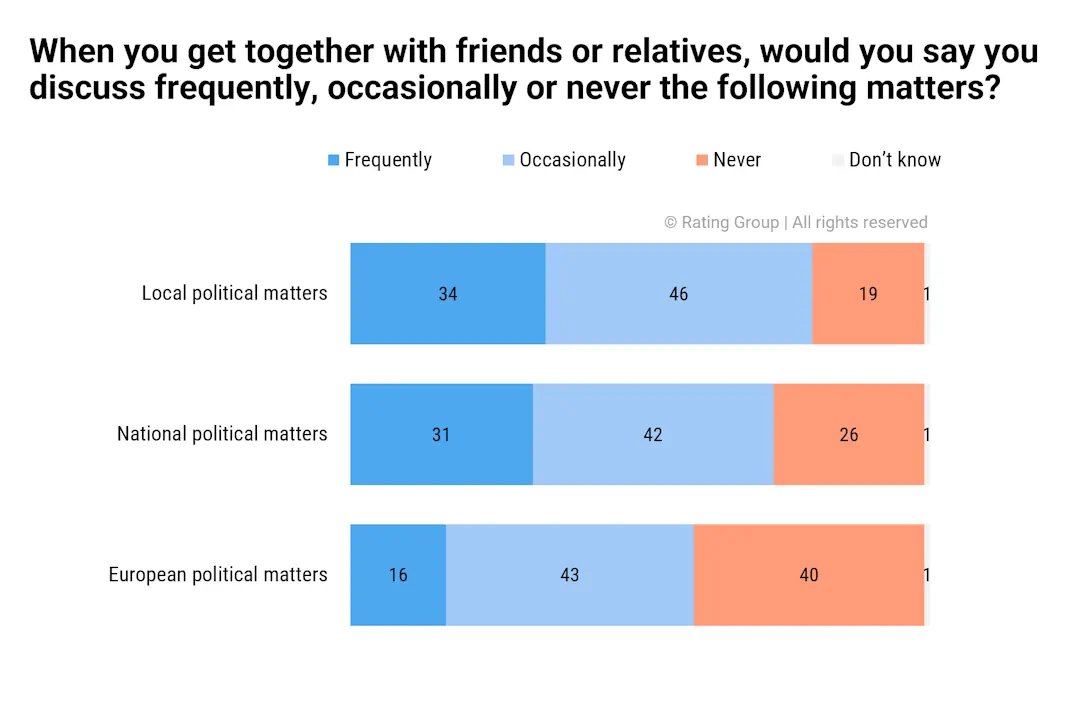
Most Ukrainians discuss local political matters (80%), national political matters in Ukraine (73%), and European political matters in general (59%) with friends or relatives. This indicates a significant level of interest in politics at different levels.
- Ukrainians’ interest in European political matters does not differ very strongly from the average across EU countries, where 70% on average discuss European politics at least occasionally.
- As in the EU on average, every seventh Ukrainian (16%) frequently discusses European political matters.
- Ukrainians discuss European politics somewhat more often than respondents in France (51%), Portugal, or Spain (56% each).
- Compared with European countries outside the EU, Ukraine’s figures are similar to those in the United Kingdom (63% discuss European politics), Albania (61%), and Turkey (59%).
Ukrainians who are interested in national politics are usually also interested in European political matters.
- For example, among respondents who frequently discuss national political matters in Ukraine, 49% also frequently discuss European political matters, while another 45% do so occasionally.
- By contrast, respondents who are not interested in Ukrainian politics are almost never interested in European political matters either (90%).
Support for EU and NATO accession
As of late June 2026, an absolute majority of Ukrainians support accession to the European Union (70%) and NATO (63%)
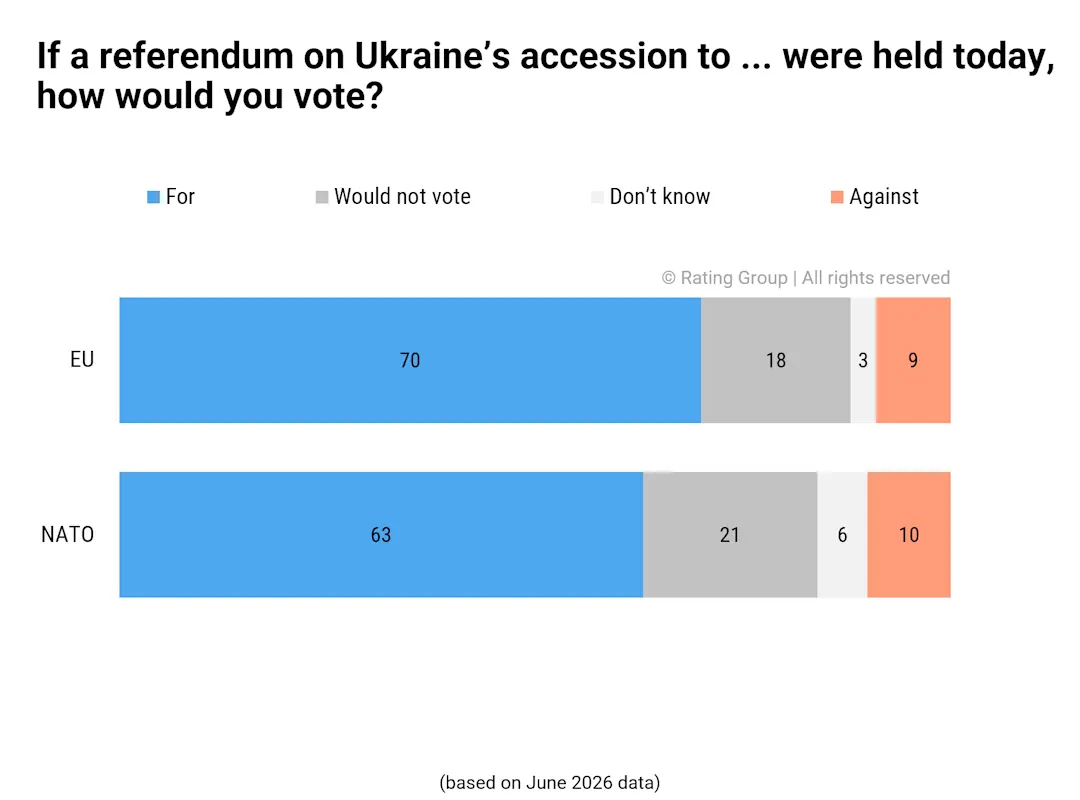
- EU accession is supported by 70% of Ukrainians.
- 9% oppose EU accession, another 18% said they would not vote in a referendum, and 3% were undecided.
- NATO accession is supported by 63% of Ukrainians.
- 10% oppose NATO accession, another one in five say they would not vote, and 6% were undecided.
How support for EU and NATO accession has changed in recent years
Overall, support for EU and NATO accession had been declining over the past three years, reaching its lowest point in April 2026. However, in June 2026, we observe a substantial increase in support.

- For example, in July 2023, 85% supported Ukraine’s accession to the EU; in July 2025, 75%; and in April 2026, 64%. However, in June 2026, support increased again to 70%.
- Similarly, in July 2023, 83% supported Ukraine’s accession to NATO; in July 2025, 70%; and in April 2026, 54%. However, support for NATO accession rose sharply to 63% in June 2026.
In June 2026, the gap between support for the EU and NATO also narrowed.
- Historically, the gap between support for the EU and NATO remained at around 10 percentage points in favor of the EU.
- It narrowed to around 5 percentage points on the eve of the full-scale invasion, and then widened again to 10 percentage points in the first months of the full-scale war.
- Since late 2022, when the Armed Forces of Ukraine had already liberated a significant part of the occupied territories and more substantial military assistance began arriving from NATO allies, support for joining NATO and the EU became almost synchronized: around 85% supported accession to both alliances.
- Starting in the summer of 2023, the gap widened again and stood at around 10 percentage points as of April 2026.
- In June 2026, the gap between support for the EU and NATO narrowed to 7 percentage points.
Comment by Hlib Kuzmenko, Research Expert and Head of Communications at Rating Group:
“Between September 2025 and April 2026, support for EU and NATO accession declined to its lowest level since the beginning of the full-scale invasion. The gap between support for EU and NATO accession also increased. Speaking about the information environment in March and April, Ukrainians likely paid attention to the absence of a unified position within NATO and the EU regarding the war in Iran, critical statements by U.S. representatives about NATO’s capacity, hints at a possible withdrawal from the Alliance, and similar developments.
Put simply, Ukrainians may have developed stronger doubts about the real capacity of NATO and the broader West in the field of security.
In June 2026, the informational and emotional environment became completely different, and attitudes toward EU and NATO accession improved. First, Ukrainians now see effective strikes by the Defense Forces against Russian targets and significant successes on the front almost every day. This certainly strengthens belief in Ukraine’s overall prospects, including its geopolitical prospects. Second, the European Union officially launched accession negotiations with Ukraine and opened the first cluster of Ukraine’s accession talks. This is a significant step forward.
There are also other positive signals regarding military and economic support for Ukraine from G7 allies, NATO, and other partners.”
What is support for EU accession associated with?
Based on April 2026 data, we identified several patterns in the views that make respondents more likely to support EU accession.
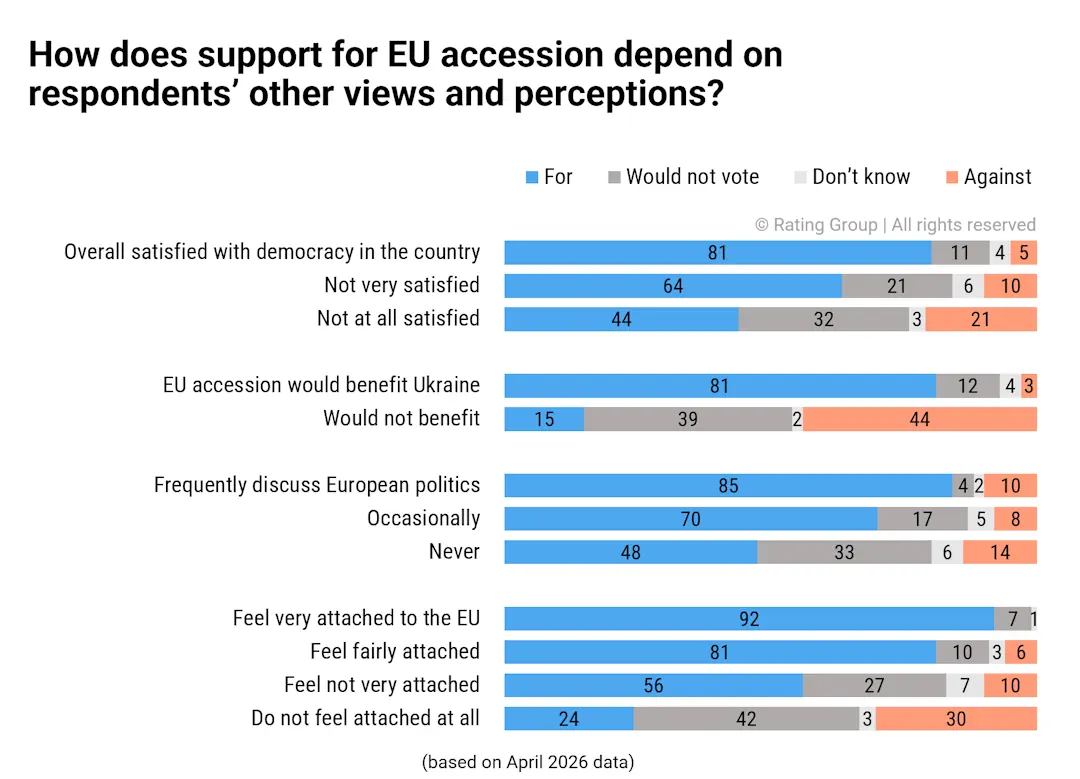
Emotional attachment to the European Union and the belief that accession would benefit the country are important foundations of support for Ukraine’s EU accession.
- Respondents who feel emotionally attached to the EU almost always support EU accession: 92% among those who feel very attached and 81% among those who feel fairly attached.
- By contrast, among respondents who do not feel attached to the EU at all, only one quarter would support Ukraine’s accession.
- The perception of benefit for the country is also an important indicator of support for accession. Among respondents who believe that Ukraine would benefit from joining the EU, 81% would vote in favor of accession in a referendum.
- Conversely, respondents who do not see benefits for Ukraine from joining the EU most often say they would vote against accession (44%) or would not vote at all (39%). Only 15% of them would support EU accession.
Respondents who are interested in European politics are more supportive of Ukraine’s European integration.
- Three quarters of respondents who frequently discuss European political matters with friends, and 70% of those who do so at least occasionally, support Ukraine’s EU accession.
- Among those who never discuss European politics, support for accession is significantly lower — 48%. Around one third (30%) would vote against accession, and 42% say they would not vote in a referendum.
Respondents who are very or fairly satisfied with the way democracy works in Ukraine mostly support EU accession (81%).
- Respondents with the most critical assessment of the state of democracy in the country — those who are not at all satisfied — support accession almost twice less often: 44% would vote in favor.
- Every fifth respondent who is dissatisfied with the way democracy works opposes EU accession. Another third say they would not take part in the vote.
Perceptions of democracy, protection of rights, and communication in the country
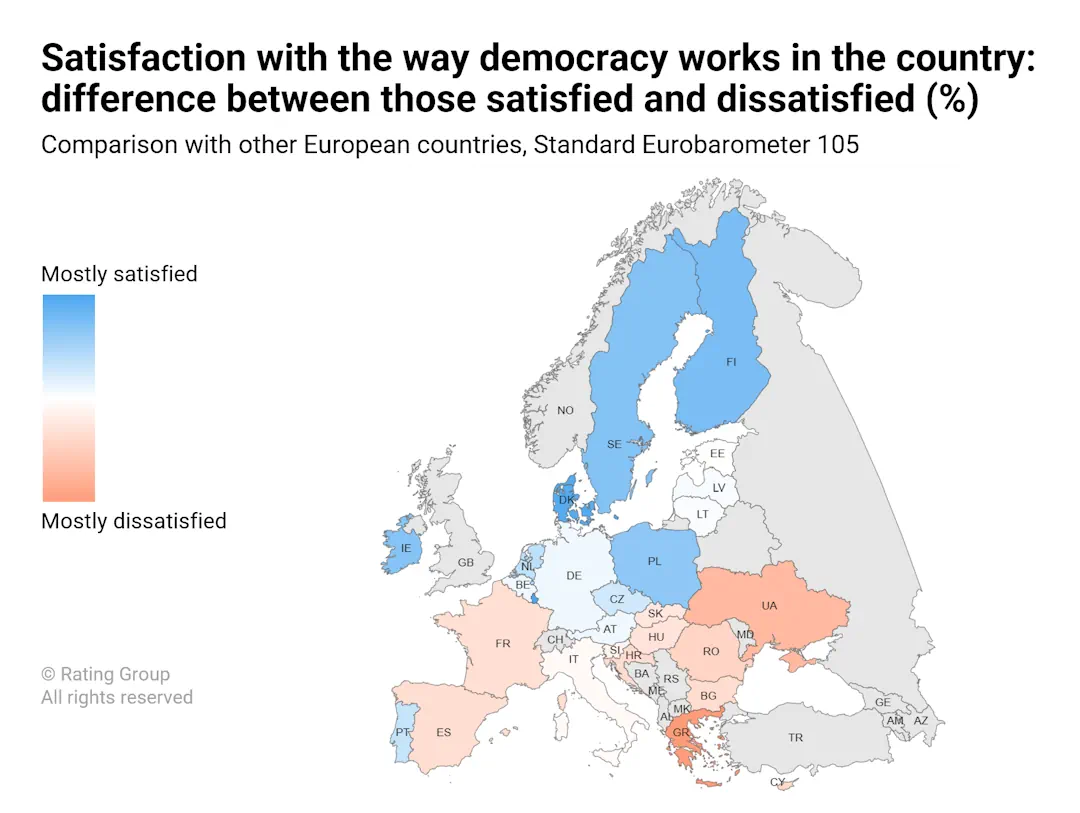
Most Ukrainians are dissatisfied with the way democracy works in the country (64%).
- Another third of Ukrainians (33%) say they are satisfied with the way democracy works in the country, while 3% were undecided.
- Ukrainians who oppose EU accession are much more likely to be dissatisfied with the state of democracy: 82%, compared with 57% among supporters of accession.
- Against the EU average, where 58% are satisfied and 40% are not, Ukrainians assess the functioning of democracy in their country more critically.
- A relatively similar situation can be observed in other European countries where the share of those dissatisfied with the state of democracy exceeds the share of those satisfied. This includes a number of countries in Eastern Europe (Romania, Bulgaria, Hungary) and Southern Europe (Greece, Cyprus, Croatia, Spain), as well as France.
More than half of Ukrainians (53%) disagree with the statement that core EU values, such as fundamental rights, democracy, and the rule of law, are properly protected in the country.
- At the same time, 44% still believe that these values are protected.
- On this indicator, Ukrainians are also more critical than residents of the European Union: on average, two thirds of EU respondents (66%) confirm that core EU values are protected in their country.
- There is a substantial difference in responses between supporters and opponents of EU accession. Among supporters of Ukraine’s accession to the EU, opinions are roughly divided: 50% still believe that EU values are protected in Ukraine, while 48% disagree.
- Meanwhile, among opponents of Ukraine’s accession to the EU, three quarters (75%) disagree with the statement.
Most Ukrainians are concerned about threats to freedom of expression, independence of the media, and disinformation. The figures are similar to those in EU countries.
- More than half of Ukrainians are very concerned about the independence of the media; the EU average is 56%.
- Disinformation is of great concern to 59% of Ukrainians and, on average, 69% of respondents in the EU.
- Freedom of expression is a major concern for 59% in Ukraine and, on average, 67% in the EU.
Project team
- Ihor Tyshchenko, Rating Group Founder & CEO
- Tetiana Skrypchenko, Rating Group Deputy Director
Research analysts
- Hlib Kuzmenko, “Common Contours” coordinator, Research Expert & Head of Communications, Rating Group
- Yevhen Krotevych, Head of Analytics, Rating Group
- Artem Shevchenko, Analyst, Rating Group
- Daryna Narolska, Analyst, Rating Group
- Lina Mukhina, Analyst, Rating Group
Data collection and processing
- Bohdan Suliatytskyi, Call Center Director
- Vitaliy Strelchenko, Head of CATI/CAWI Projects Department
- Dmytro Ponochovnyi, Data Processing Specialist
Rating Group is one of Ukraine's largest research institutions, operating since 2008. The company is registered in Ukraine and has extensive experience conducting sociological surveys both within Ukraine and abroad. The group includes: Rating Sociological Group, Rating Lab research laboratory, Rating Online platform, and Rating Call Center.

Ukrainian society combines a sense of closeness to the country with a closeness to the wider, European space, shows issue #6 of the “Common Contours” study by the Rating Group
"Common Contours" is a survey about Ukraine in a European context, where we reflect questions and compare data from our own surveys of Ukrainians with data from other surveys in EU countries, candidate countries, and other European countries. In this issue, we compare our own research data with Eurobarometer data – a series of official EU surveys from the European Commission and the European Parliament. Eurobarometer data belongs directly to the EU, and we thank them for open access to it.
Emotional connection with the country and city / village
- 93% of respondents feel an emotional connection with Ukraine.
- However, the intensity of the connection of Ukrainians with the country is higher than the average in EU countries: if in Ukraine 69% have a pronouncedly strong emotional connection with the country, such sentiment is shared by 52% on the EU countries.
- 84% of Ukrainians feel close to the city / village.
- A similar sentiment towards their native settlement is shared by respondents in the countries of Northern Europe (83-84%), Estonia (84%), and France (85%).
Emotional connection with the EU & Europe
Although Ukraine is not yet a member of the EU, most citizens feel an emotional closeness to the EU and Europe in general. The estimates are comparable to the estimates in the EU member states
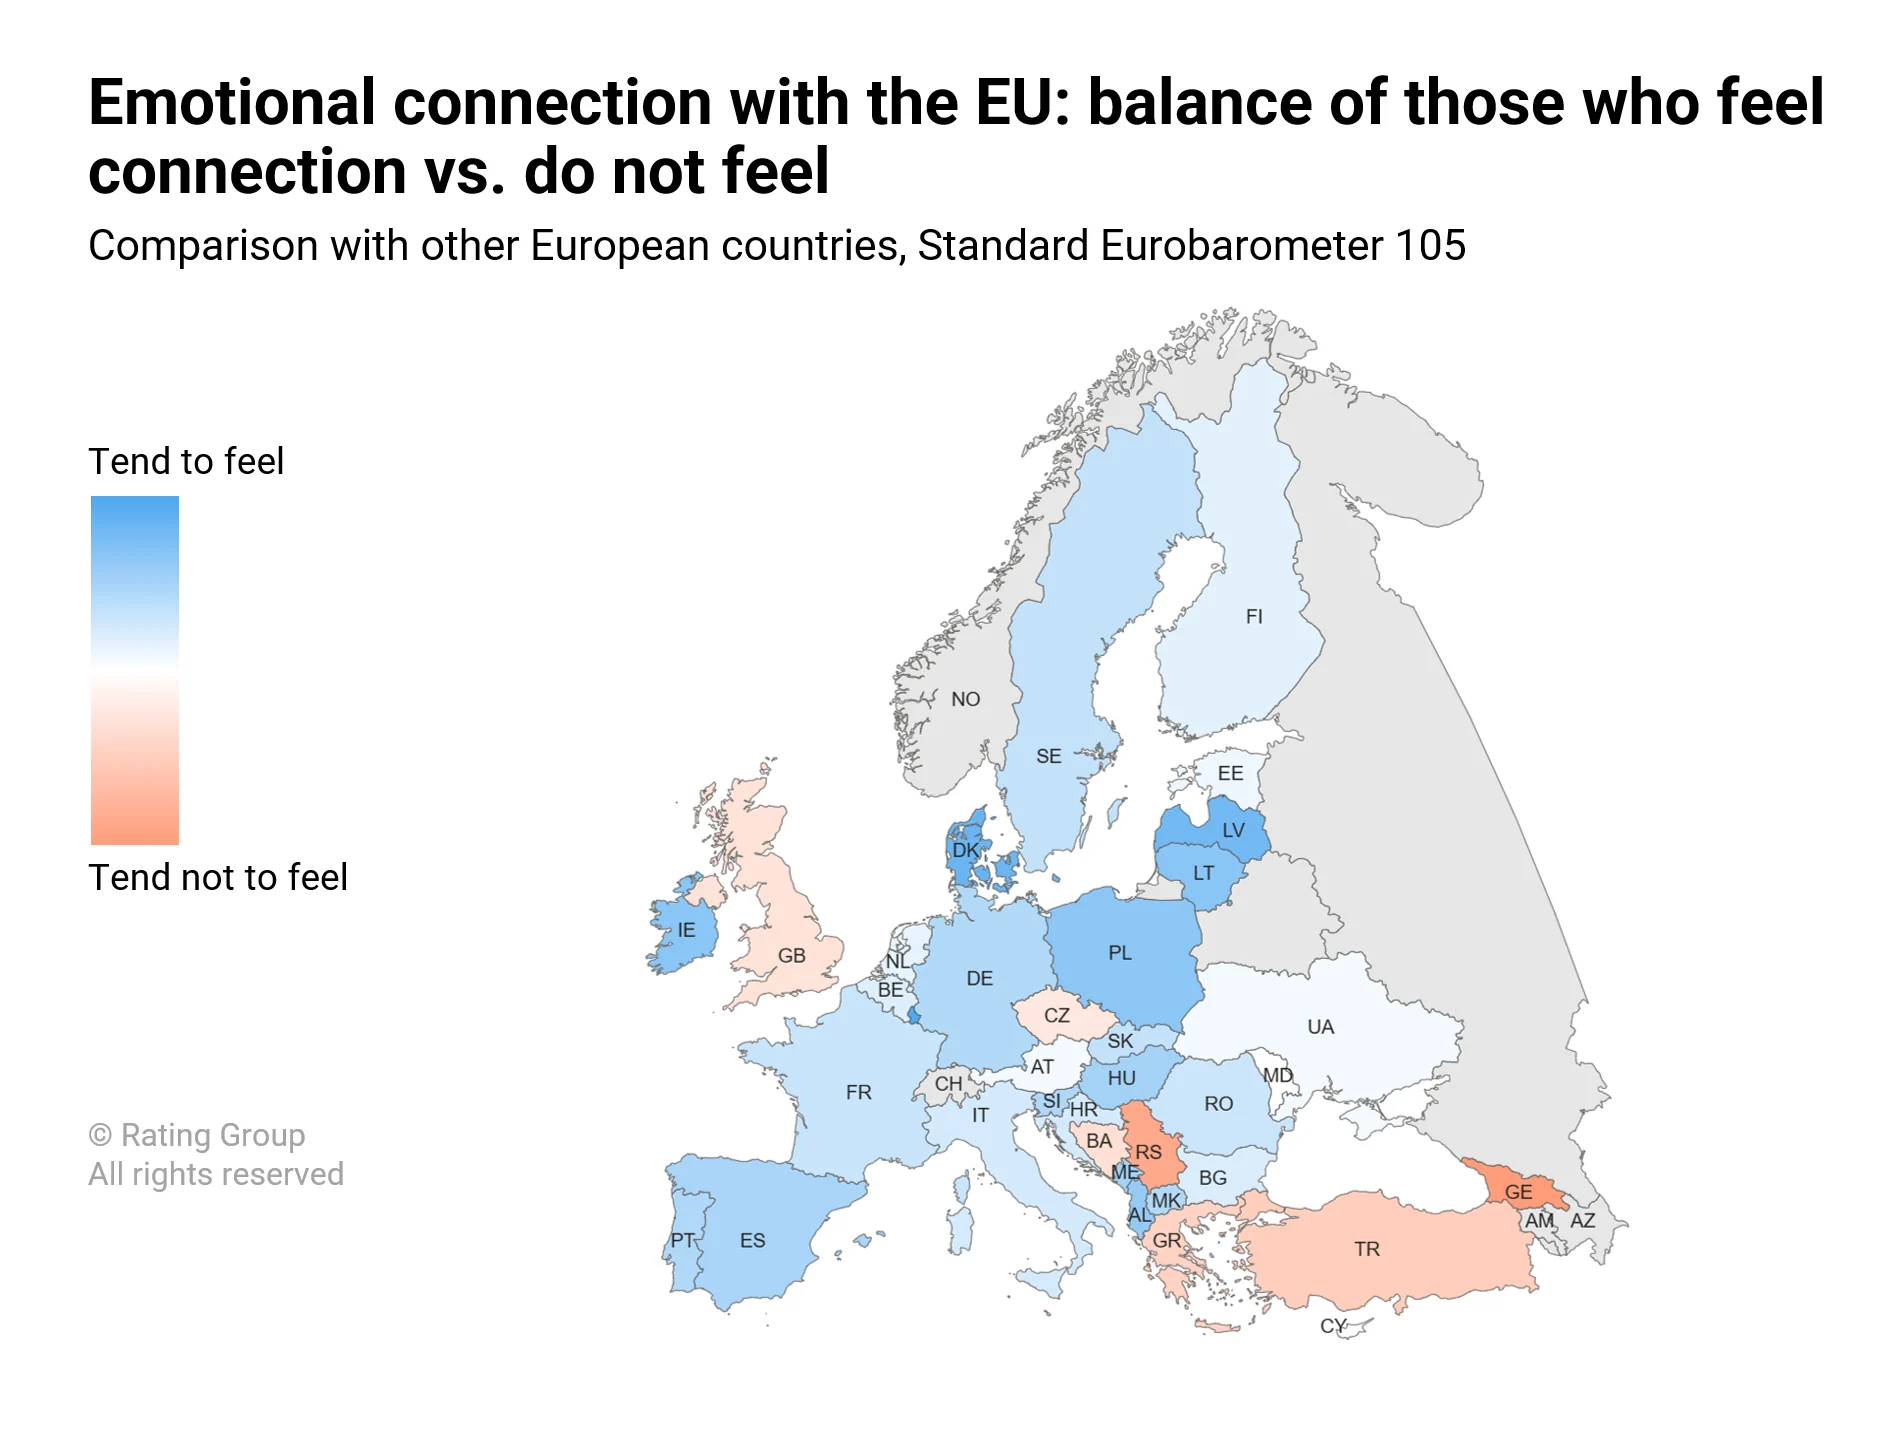
- More than half of Ukrainians feel emotional connection with the EU (51%) and Europe in general (56%).
- For comparison: on average in the European Union countries, 62% feel an emotional connection with the EU.
- The level of emotional connection with the EU in Ukraine is similar to the estiamtes in Cyprus (52%), Austria (54%), Estonia (54%), Finland (56%), the Netherlands (56%) and is somewhat higher than in the Czech Republic (44%) and Greece (38%).
- Older respondents, respondents with higher income and education levels, residents of Kyiv, and western regions feel relatively stronger connection EU.
- Logically, among supporters of joining the EU, the majority feel an emotional connection with the European Union (67%).
Ukraine belongs to the candidate countries with the strongest emotional attachment to the EU
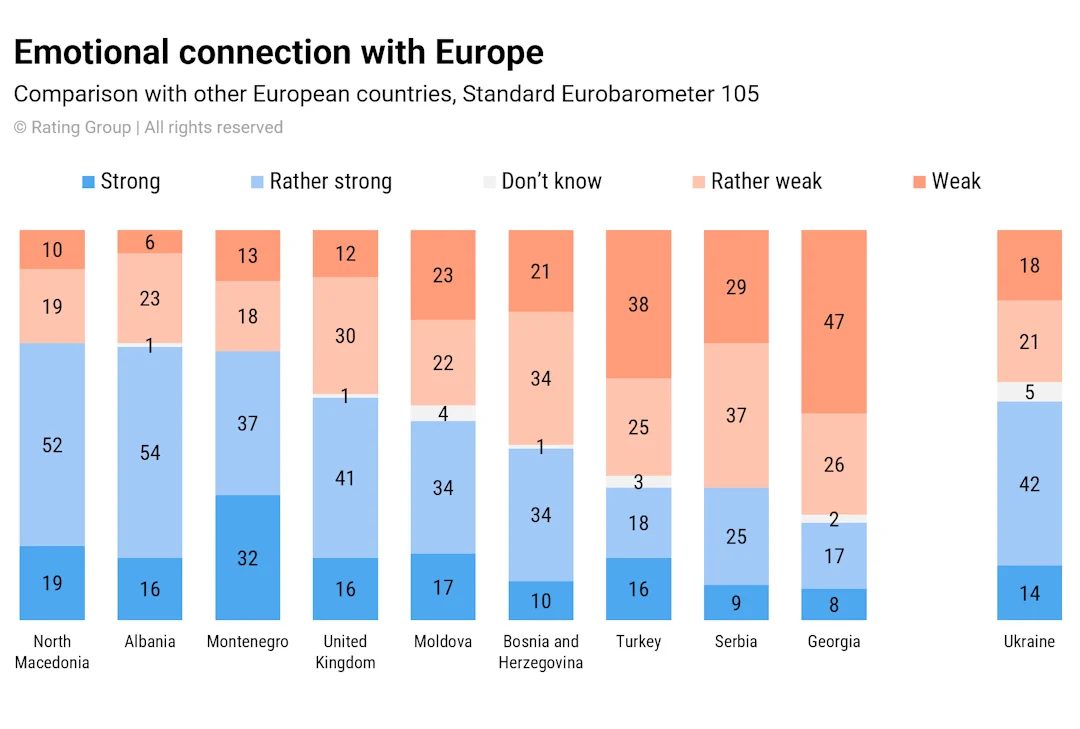
- Among the candidate countries, the highest level of emotional connection with the EU is felt by residents of Albania (70%), Montenegro (68%), North Macedonia (55%), Ukraine (51%), and slightly less by residents of Moldova (49%).
- To compare, 42% in the United Kingdom and Bosnia and Herzegovina, 1/3 in Turkey, only 25% in Serbia, and 20% in Georgia feel emotional attachment to the EU.
Rating Group is one of Ukraine's largest research institutions, operating since 2008. The company is registered in Ukraine and has extensive experience conducting sociological surveys both within Ukraine and abroad. The group includes: Rating Sociological Group, Rating Lab research laboratory, Rating Online platform, and Rating Call Center.

What are the educational needs of Ukrainian veterans? What motivates them to pursue education after their service, and what education formats interest them most?
Find out in the results of a survey conducted by the Rating Group and the Ukrainian Veterans Fund of the Ministry of Veterans Affairs in December 2025.
Education needs
- A quarter of veterans indicated a need for education after discharge from service.
- However, the majority reported that there was no such need.
Motivation and decision to pursue education
- Among respondents who reported a need for education, the most frequently cited purpose of pursuing education after service was self-development and personal growth – 60%.
- One-third of respondents – 33% – mentioned a change of occupation compared to their activities before military service. Increasing competitiveness in the labour market was selected by 22% of respondents. Rapid entry into the labour market and meeting new people/socialisation were each mentioned by 17%.
- More than half of respondents who had a need for education – 57% – did not participate in educational programmes for veterans. A total of 28% completed an educational programme, while another 15% reported that they had started but did not complete their studies.
- Among those who had a need for education and used educational opportunities, 65% chose formal education – higher education, professional pre-higher or vocational education and training. Professional training and retraining courses were completed by 42% of respondents. Non-formal education – trainings, seminars, consultations and online courses – was used by 27%. Grants and financial support for education were mentioned by 19%.
- Respondents who had a need for education but did not participate in training most often cited lack of time as the main reason – 32%. Lack of funds was mentioned by 26%, while bureaucratic barriers and health problems were each selected by 21%. Lack of information about educational opportunities was reported by 18%. An educational environment not adapted for people with disabilities and the fact that the need had already been fulfilled were each mentioned by 9%.
Perception of education opportunities
- When speaking about factors that make educational opportunities more appealing, 28% of veterans mentioned support with subsequent employment. Affordable cost or free education, as well as the opportunity to combine education with work, were each selected by 25%.
- The opportunity to study online was mentioned by 19%. Receiving a certificate was selected by 14%, while a practical learning format – projects, case studies and internships – and a flexible asynchronous schedule were each mentioned by 11%. Mentoring support was reported by 8%, and the reputation of the organisation or instructors by 7%. At the same time, 27% did not select any of the listed factors.
- Support with subsequent employment as a factor making educational opportunities more appealing was mentioned more often by respondents from frontline territories, younger respondents aged 21–35, women veterans and low-income respondents. Affordable education was more often mentioned by respondents from central regions, younger respondents, women veterans, and respondents with medium or sufficient income levels. The opportunity to combine education with work was mentioned somewhat more often by respondents from western and central regions, women veterans, respondents with medium or sufficient income levels, and people with higher education.
Education formats
- Formal education was selected as the preferred education format by 34% of respondents. Professional training and retraining courses were selected by 27%, while non-formal education was chosen by 23%. The option “none” was selected by 18%.
- Formal education is more appealing to residents of frontline territories and younger respondents aged 21-35. Professional training courses were more often selected by veterans from western and central regions, women veterans and respondents without disabilities.
- Non-formal courses were mentioned somewhat more often by veterans from central regions and by low- and medium-income respondents.
- As for the optimal duration of educational programmes, respondents’ opinions were divided as follows: 20% consider 3-6 months to be optimal, and the same share – 20% – selected programmes lasting more than one year. A duration of 1-3 months was mentioned by 18%, while 6-12 months was selected by 15%. Programmes lasting less than one month were chosen by 4%. A total of 23% were undecided.
Perception of education providers
- According to respondents, the preferred providers of educational services are state educational institutions – 45%.
- Private educational companies and resources, as well as educational programmes offered by civil society organisations and donors, were each selected by 18% of respondents. Educational programmes offered by businesses were chosen by 15%. A total of 19% of surveyed veterans were undecided on this issue.
- State educational institutions were more often selected by respondents from frontline regions, younger respondents aged 21-35, women veterans, low-income respondents and people with higher education.
- Educational programmes offered by civil society organisations are more appealing to veterans from central regions and older respondents aged 46 and above.
- Private educational companies and resources are relatively more appealing to respondents from frontline regions, younger respondents, women veterans and higher-income respondents.
Themes of interest
- Among educational opportunities by area of interest, surveyed veterans most often mentioned information technology and digital professions – 17% – and construction, architecture and design – also 17%. Engineering, manufacturing and industry were selected by 16%. Military affairs, security and the defence industry were mentioned by 14%.
- Transport, logistics and aviation/maritime affairs were selected by 13%; law, public administration and policy by 12%; and economics, finance and entrepreneurship by 11%.
- Education, culture and humanities were chosen by 10%; medicine, pharmaceuticals and social services by 9%; the agricultural sector and food industry by 8%; and services, hospitality and restaurant business and tourism, as well as communications and media, by 6% each. The option “none of the above” was selected by 16%.
- The breakdowns by age and gender show notable differences. Information technology and digital professions; military affairs, security and the defence industry; and economics, finance, entrepreneurship and business administration were more often selected by younger respondents aged 21-35. Transport, logistics and aviation/maritime affairs were more often chosen by older respondents aged 46 and above. Construction, architecture and design were selected more often by men veterans, while military affairs, security and the defence industry; law, public administration and policy; education, culture and humanities; and especially medicine, pharmaceuticals and social services were more often selected by women veterans.
Rating Group is one of Ukraine's largest research institutions, operating since 2008. The company is registered in Ukraine and has extensive experience conducting sociological surveys both within Ukraine and abroad. The group includes: Rating Sociological Group, Rating Lab research laboratory, Rating Online platform, and Rating Call Center.

4-12 травня 2026 року Rating Group (Соціологічна група "Рейтинг") опитала 1100 мешканців Одеської області щодо оцінки релігійної ситуації в Україні. Нижче - ключові знахідки дослідження.
Ставлення до різних конфесій
- Недовіра до людей інших релігійних конфесій є меншою (31%) порівняно з недовірою до людей інших політичних поглядів (36%) або іншої національності (59%).
- Серед лідерів релігійних конфесій найбільшу довіру опитані висловлюють до митрополита Епіфанія, Предстоятеля Православної Церкви України (41%), найменшу - Патріарха Російської Православної Церкви Кирила (6%).
- На думку опитаних, відносини між вірянами різних церков і релігій є більш дружніми або спокійними у місцевості, де вони проживають (78%), ніж загалом в Україні (47%).
Релігійна приналежність
- 32% мешканців Одеської області називають себе православними, проте не відносять себе до жодної конфесії, 17% відносять себе до Православної Церкви України (митрополит Епіфаній), 16% - до невіруючих, атеїстів, 15% - до віруючих, що не відносять себе до жодної конфесії, 11% - до вірян Української Православної Церкви (митрополит Онуфрій). 50% православних зазначили вплив на визначення своєї конфесії сімейними традиціями та вихованням, 37% - усвідомленим вибором у дорослому віці, 25% - культурною та національною ідентичністю.
- Серед тих, хто не відносить себе до жодної православної конфесії, 35% називають вважають релігію особистою справою, 22% ніколи не замислювалися над питанням визначення конфесії, 16% не довіряють церковним інституціям загалом, ще 16% зазначають суперечності та конфлікти між православними конфесіями.
- 91% опитаних святкують Різдво, з них 32% - 25 грудня, інші 32% - 7 січня, 27% двічі – 25 грудня і 7 січня.
Релігійні вірування та практики
Більшість респондентів в Одеській області (74%) вірять у Бога, а ще 14% не вірять в Бога, але вірять у вищі сили
- Ще 11% не вірять в існування Бога та вищих сил.
- За словами 54% опитаних, їхні релігійні погляди і конфесійна приналежність не змінились з початку повномасштабного вторгнення, у 15% посилилися, у 7% послабилися. 23% не були релігійними і не стали на цей момент.
- Серед релігійних практик мешканці Одеської області найчастіше носять релігійні символи (41%), моляться вдома (33%), читають або слухають релігійні тексти (14%), відвідують богослужіння – 10%. Спілкуються з духовними наставниками 8%, дотримуються посту – 6%, займаються духовними практиками – 5%.
- У виборі церкви опитані частіше керуються територіальною близькістю (40%), особистістю священника (32%), атмосферою (23%), належністю до конфесії (18%), мовою богослужіння (17%).
Оцінка релігійної ситуації в Україні
- Більшість мешканців Одеської області (65%) оцінюють ступінь свободи віросповідання в Україні як високий, 31% - як низький. Абсолютна більшість (89%) не зазначали утисків через релігійні переконання ані щодо себе, ані щодо своїх близьких.
- 55% респондентів вважають, що богослужіння має вестись українською мовою, 39% - мовою, традиційною для конфесії.
- Більше половини (55%) вважають, що краще, коли люди в суспільстві мають різні вірування, 39% - якщо вірування є однаковими.
- 60% вважають, що Церква в Україні має бути відокремлена від держави, натомість 35% не погоджуються з цим.
- 78% опитаних погоджуються із тим, що держава має регулювати релігійні організації, якщо вони порушують законодавство або загрожують суверенітету України.
Створення ПЦУ
- 55% респондентів позитивно оцінюють створення Єдиної Помісної Церкви – Православної Церкви України, більше третини байдуже ставляться до цієї події.
- 50% мешканців Одеської області підтримують ідею об’єднання православних церков – Православної Церкви України та Української Православної Церкви в єдину Православну Церкву України
- Ідею об’єднання усіх православних церков, зокрема Православної Церкви України, Української Православної Церкви і Української Греко-католицької Церкви в єдину Православну Церкву України підтримують 39% респондентів.
Питання зв'язку релігійних організацій в Україні з російською церквою
- 73% опитаних підтримують ідею розриву зв’язків Української Православної Церкви з Російською Православною Церквою через російську агресію проти України.
- 56% підтримують закон, який забороняє діяльність релігійних організацій, пов’язаних з державою-агресором росією.
- 48% підтримують ідею заборонити діяльність Української Православної Церкви під керівництвом митрополита Онуфрія через зв’язки з Російською Православною Церквою. Також 55% опитаних підтримують введення санкцій щодо митрополита Онуфрія через його зв’язки з Російською Православною Церквою.
Національна приналежність
- 86% опитаних мешканців Одеської області вважають себе українцями за національністю, тільки 4% - росіянами.
- Ще 3% вказали приналежність до болгар, а 1% - до гагаузів.
Rating Group — одна з найбільших дослідницьких інституцій України, яка на ринку з 2008 року. Компанія зареєстрована в Україні та має значний досвід проведення соціологічних опитувань в Україні та за кордоном. До групи входять: Соціологічна група Рейтинг, дослідницька лабораторія Rating Lab, платформа Rating Online та Rating Call Center.

Як українці оцінюють релігійну ситуацію в Україні? 4-9 травня 2026 року Rating Group (Соціологічна група "Рейтинг") опитала 2000 українців щодо релігійної ситуації в Україні. Нижче - ключові знахідки дослідження.
Ставлення до різних конфесій
- Недовіра до людей інших релігійних конфесій є невисокою (31%) порівняно з недовірою до людей інших політичних поглядів (60%) або іншої національності (38%).
- Серед лідерів релігійних конфесій найбільшу довіру українців має митрополит Епіфаній, Предстоятель Православної Церкви України (47%), найменшу - Патріарх Російської Православної Церкви Кирило (3%), рівень недовіри до якого різко зріс у порівнянні з даними 2018 р.
- На думку опитаних, відносини між вірянами різних церков і релігій є більш дружніми або спокійними у місцевості, де вони проживають (74%), ніж загалом в Україні (48%).
Релігійна приналежність
- 26% українців відносять себе до православних, без визначення конкретної конфесії, 22% - до Православної Церкви України (митрополит Епіфаній), 16% - до віруючих, що не належать до жодної конфесії.
- 46% православних зазначили вплив на визначення своєї конфесії сімейними традиціями та вихованням, 37% - усвідомленим вибором у дорослому віці, 28% - культурною та національною ідентичністю.
- 38% опитаних не відносять себе до жодної православної конфесії через думку про те, що релігія – це особиста справа, 27% ніколи не замислювалися над питанням визначення конфесії, 19% не довіряють церковним інституціям загалом, 16% - через суперечності та конфлікти між православними конфесіями.
- 90% українців святкують Різдво, з них 51% - 25 грудня, 18% - 7 січня, 21% двічі – 25 грудня і 7 січня.
Релігійні вірування та практики
Абсолютна більшість респондентів загалом вірить в існування Бога (78%). Ще 12% не вірять у Бога, але вірять в існування вищих сил
- Більше половини респондентів (56%) вважають, що Бог існує, і не сумніваються в цьому, 22% вірять в існування Бога, однак іноді сумніваються, 12% не вірять в Бога, але вірять у вищі сили, 8% не вірять в існування Бога та вищих сил.
- У 56% опитаних не змінились релігійні погляди і конфесійна приналежність з початку повномасштабного вторгнення, у 18% посилилися, у 6% послабилися, 19% не були релігійними і не стали зараз.
- Серед релігійних практик найчастіше українці згадують носіння релігійних символів (42%), молитви вдома (36%), читання або слухання релігійних текстів (18%), відвідування богослужіння у церквах (13%). Спілкуються з духовними наставниками та дотримуються посту по 9%, займаються духовними практиками та медитаціями – 7% опитаних.
- У виборі церкви опитані частіше керуються територіальною близькістю (36%), особистістю священниками (30%), атмосферою (23%), мовою богослужіння (22%), належністю до конфесії (20%).
Релігійна ситуація в Україні, свобода віросповідання
- 68% українців оцінюють ступінь свободи віросповідання в Україні як високий, 27% - як низький. Абсолютна більшість опитаних (88%) не зазнавали утисків через релігійні переконання ані щодо себе, ані щодо своїх близьких.
- На думку 70% респондентів, основною мовою богослужіння в Україні має бути українська, 24% - мова, традиційна для конфесії.
- 50% респондентів вважають, що краще, коли люди в суспільстві мають різні вірування, 42% - якщо вірування є однаковими.
- 50% опитаних вважають, що Церква в Україні має бути відокремлена від держави, тоді як 45% підтримують протилежне твердження.
- Переважна більшість опитаних (79%) погоджується із твердженням, що держава має регулювати релігійні організації, якщо вони є загрозою для України.
Створення ПЦУ
- 60% респондентів позитивно оцінюють створення єдиної Помісної Церкви, близько третини висловлюють байдужість до цієї події.
- 54% респондентів підтримують ідею об’єднання православних церков – Православної Церкви України та Української Православної Церкви в єдину Православну Церкву України, 45% - ідею об’єднання усіх православних церков, зокрема Православної Церкви України, Української Православної Церкви і Української Греко-католицької Церкви в єдину Православну Церкву України.
Питання зв'язку релігійних організацій в Україні з російською церквою
- 80% опитаних підтримують ідею розриву зв’язків Української православної церкви з Російською православною церквою через російську агресію проти України.
- 62% опитаних підтримують закон, який забороняє діяльність релігійних організацій, пов’язаних з державою-агресором росією.
- 57% підтримують ідею заборонити діяльність Української Православної Церкви під керівництвом митрополита Онуфрія через зв’язки з Російською Православною Церквою. Також 67% опитаних підтримують введення санкцій щодо митрополита Онуфрія через його зв’язки з Російською православною церквою.
Rating Group — одна з найбільших дослідницьких інституцій України, яка на ринку з 2008 року. Компанія зареєстрована в Україні та має значний досвід проведення соціологічних опитувань в Україні та за кордоном. До групи входять: Соціологічна група Рейтинг, дослідницька лабораторія Rating Lab, платформа Rating Online та Rating Call Center.

До Дня Києва 2026 Соціологічна група "Рейтинг" (Rating Group) опитала 1200 мешканців Києва та дізналася думку громади про:
- сприйняття загальної ситуацію в Україні та місті
- відзначення Дня Києва
- діяльність місцевої влади
Ситуація в Україні та Києві зокрема
- 46% опитаних киян кажуть, що справи в Україні загалом йдуть у неправильному напрямку, тоді як 32% - що в правильному. 21% не змогли дати однозначну відповідь на це питання.
- З кінця 2025 року в киян з'явилося дещо більше оптимізму: у листопаді про те, що справи в Україні рухаються в правильному напрямку, казали 24%, нині - третина.
- 82% киян вважають Київ у цілому комфортним для життя. Порівняно з результатами опитування, проведеного у серпні 2021 р., дещо зросла частка киян, які вважають столицю комфортною для проживання (з 75% до 82%).
- Серед наявних можливостей у Києві найкраще опитані оцінюють можливості знайти роботу в місті (7,8 балів), відпочивати та проводити дозвілля (7,5) і досягти успіху (7,0).
- Інші можливості оцінені гірше, зокрема заняття підприємництвом (5,6), проживання у безпеці (4,4).
День Києва
Абсолютна більшість мешканців столиці (87%) пишається тим, що проживає у Києві
- Серед основних причин гордості за Київ респонденти найчастіше називають її історію, культурну спадщину (62%), парки, зелені зони (56%), культурне життя (46%) та можливості для самореалізації (41%).
- Половина опитаних киян планують відзначати День Києва (50%), водночас 47% респондентів не мають таких намірів.
- Найбільш популярними форматами святкування Дня Києва є прогулянки містом, парками чи історичними місцями (56%) та зустрічі із родиною або друзями (53%).
Діяльність влади
- 33% опитаних зазначають, що за час перебування Віталія Кличка на посаді мера ситуація у місті покращилась, 35% - що вона не змінилась, 25% зазначають про погіршення.
- 54% опитаних вважають, що основну відповідальність за забезпечення енергостійкості та захист критичної інфраструктури столиці України від обстрілів несе центральна влада, 32% - місцева влада.
- Половина опитаних вважають успішними зусилля мера представляти інтереси Києва та залучати міжнародну допомогу для ліквідації наслідків обстрілів. 35% мають протилежну думку.
Пріоритети для міської влади й окремі ініціативи
- Серед найбільш пріоритетних сфер для міської влади кияни насамперед зазначають безпеку в місті (49%), допомогу армії (33%) й облаштування бомбосховищ і укриттів (33%).
- Також як пріоритетні сфери часто називають прозорість роботи влади і боротьбу з корупцією (26%), роботу медичних закладів (20%), благоустрій дворів і прибудинкових територій (20%), якість комунальних послуг (19%).
- Майже 80% опитаних підтримують ініціативу облаштувати безбар’єрний громадський простір із фонтаном на місці колишнього пам’ятника Леніну на Бессарабській площі на кошти меценатів.
Rating Group — одна з найбільших дослідницьких інституцій України, яка на ринку з 2008 року. Компанія зареєстрована в Україні та має значний досвід проведення соціологічних опитувань в Україні та за кордоном. До групи входять: Соціологічна група Рейтинг, дослідницька лабораторія Rating Lab, платформа Rating Online та Rating Call Center.

Ukraine in Europe's Security Architecture - a new special study from the Rating Group team (Sociological Group "Rating"). In spring 2026, we found out what Ukrainians think about the following questions:
- What is Ukraine's status among other European countries?
- Who are the AFU currently defending: only the people of Ukraine, or also other European nations?
- Would Ukrainians support the AFU's participation in defending several other European countries if Russia attacked them?
We compare the results for some questions over time with our 2022 studies.
Ukraine's Status Among European Countries
We asked respondents to assess where they would place Ukraine when compared to other European countries: among leaders, middle-performers, or outsiders.
A relative majority of Ukrainians (40%) believe that Ukraine is a leading country when compared to other European countries.

- A third classify it as a middle-performer, and another 21% as an outsider.
- Since 2022, the proportion of Ukrainians who classify Ukraine as a "middle-performer" among European countries has decreased (from 42% in March 2022 to 33% in April 2026).
- Conversely, there's an increase in views in which Ukraine is either a leader (from 34% in March 2022 to 40% in April 2026) or, conversely, an outsider (from 16% to 21%).
- For context, it's worth noting that the perception of Ukraine as a leading state strengthened from the first months of the full-scale invasion and the first significant successes of the AFU at the front. For example, in January 2022, only 8% called Ukraine a leader, while half (49%) considered it an outsider. However, in March 2022, a third of citizens began to consider Ukraine a leader, and only 16% an outsider.
Who are the AFU defending?
An absolute majority of Ukrainians see Ukraine as an integral part of Europe's security architecture: they believe that in the war, the AFU are defending not only the Ukrainian people but also Europe as a whole.
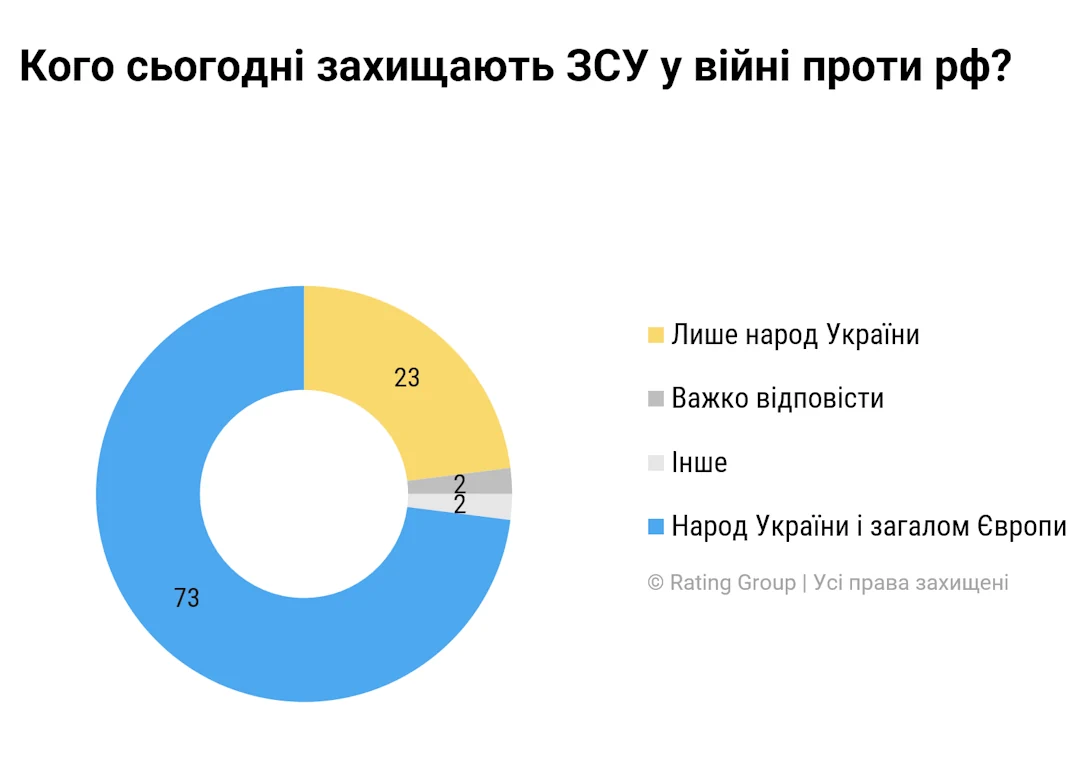
- Just like four years ago, approximately three-quarters of Ukrainians (73%) believe that in the war, the AFU are defending both the people of Ukraine and other European nations..
- 23% say that the AFU are defending only the people of Ukraine.
- Citizens who would vote for Ukraine's accession to the EU even more frequently believe that the AFU are defending both the people of Ukraine and other European nations (84%). Only 15% among supporters of EU accession believe that in the war, the AFU are defending only the people of Ukraine.
- Among opponents of EU accession, there are significantly fewer respondents who believe that the AFU are defending both the people of Ukraine and Europe as a whole (57%).
Do Ukrainians support the participation of the Armed Forces of Ukraine in defending other European countries if Russia attacks them?
We asked respondents to imagine that Russia invades certain European countries and to answer whether they would support the participation of Ukrainian troops in defending such countries: Moldova, Poland, the Baltic states (Lithuania, Latvia, Estonia), and Finland.
The absolute majority of Ukrainians would support the participation of Ukrainian troops in defending the Baltic states (Lithuania, Latvia, Estonia), Moldova, Finland, and Poland in the event of a Russian attack.
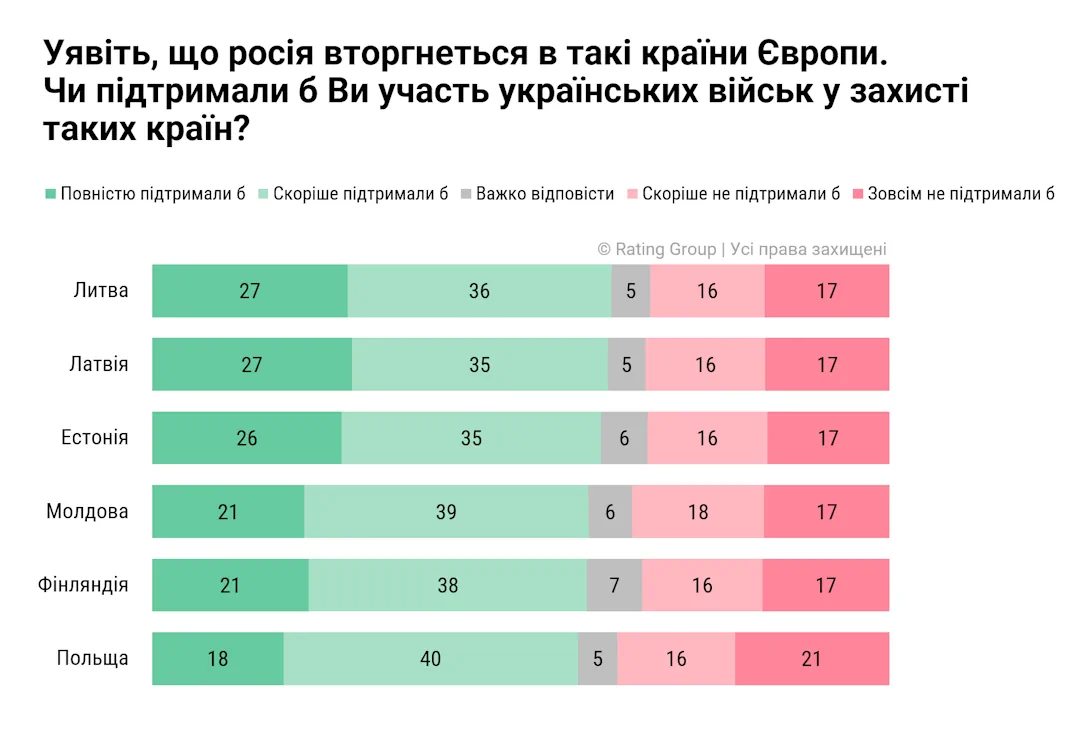
More than half of Ukrainians would support the participation of the Armed Forces of Ukraine in defending all allied countries on the list if Russia attacked them:
- Lithuania: 63% – would support, 33% – would not support
- Latvia: 62% – would support, 33% – would not support
- Estonia: 61% – would support, 33% – would not support
- Moldova: 60% – would support, 35% – would not support
- Finland: 59% – would support, 33% – would not support
- Poland: 58% – would support, 37% – would not support
The stronger Ukrainians' emotional connection to the EU, the more they support the AFU's assistance to other countries in the event of a Russian attack.
Let's take support for Estonia as an example.
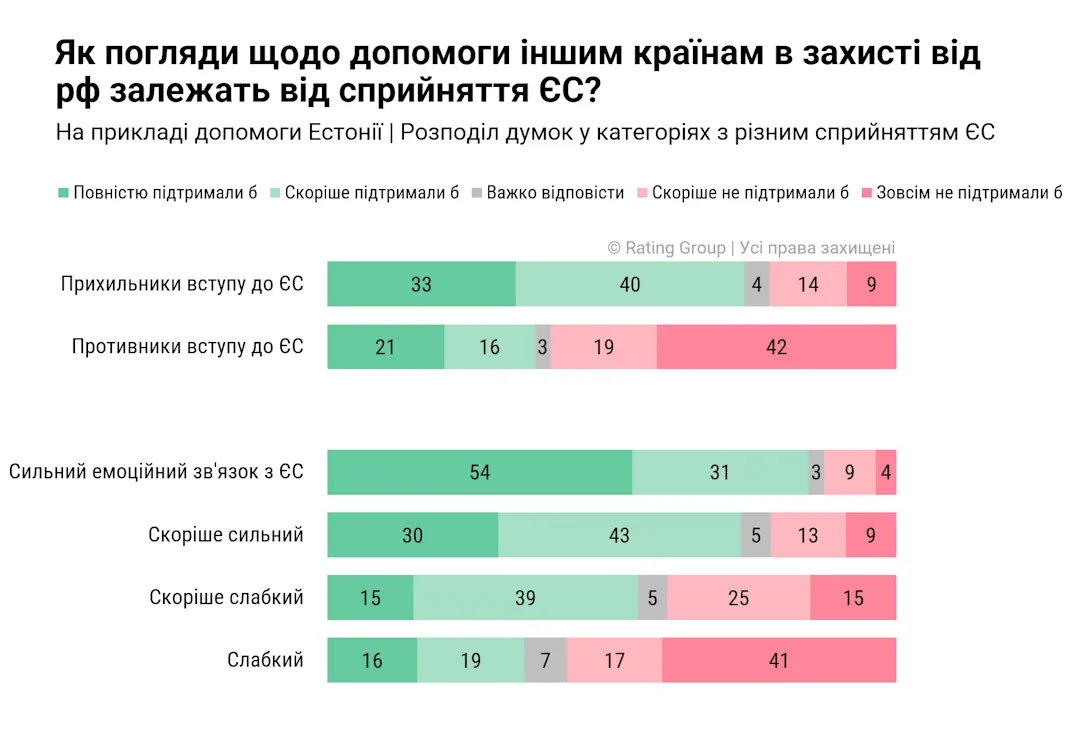
- Among Ukrainians who would vote in a referendum for EU membership, 73% of citizens would support AFU assistance to Estonia.
- Among opponents of EU membership, only 37% would support it, while the absolute majority (61%) would be against it.
- Among Ukrainians with a strong emotional connection to the EU, 85% would support armed assistance to Estonia.
- In comparison, among those who weakly associate themselves with the EU, only a third (35%) would support such a decision, while 58% would be against it.
Rating Group is one of Ukraine's largest research institutions, operating in the market since 2008. The company is registered in Ukraine and has significant experience conducting sociological surveys in Ukraine and abroad. The group includes: Sociological Group Rating, Rating Lab research laboratory, Rating Online platform, and Rating Call Center.

"Rating" Sociological Group presents the fifth issue of its special research project "Common Contours". This time, we investigated which social issues concerning the country's future most concern Ukrainians during the full-scale war, and compared these sentiments with data from EU countries.
"Common Contours" is a survey about Ukraine in a European context, where we reflect questions and compare data from our own surveys of Ukrainians with data from other surveys in EU countries, candidate countries, and other European countries. In this issue, we compare our own research data with Eurobarometer data – a series of official EU surveys from the European Commission and the European Parliament. Eurobarometer data belongs directly to the EU, and we thank them for open access to it.
Note: This study examined a specific list of social issues from the Eurobarometer survey, which was researched in EU countries. This is not an exhaustive list of issues that may concern Ukrainians, especially during the full-scale war. The research results should be interpreted as relative indicators of priorities and differences in perception between Ukrainians and other European countries.
General Findings
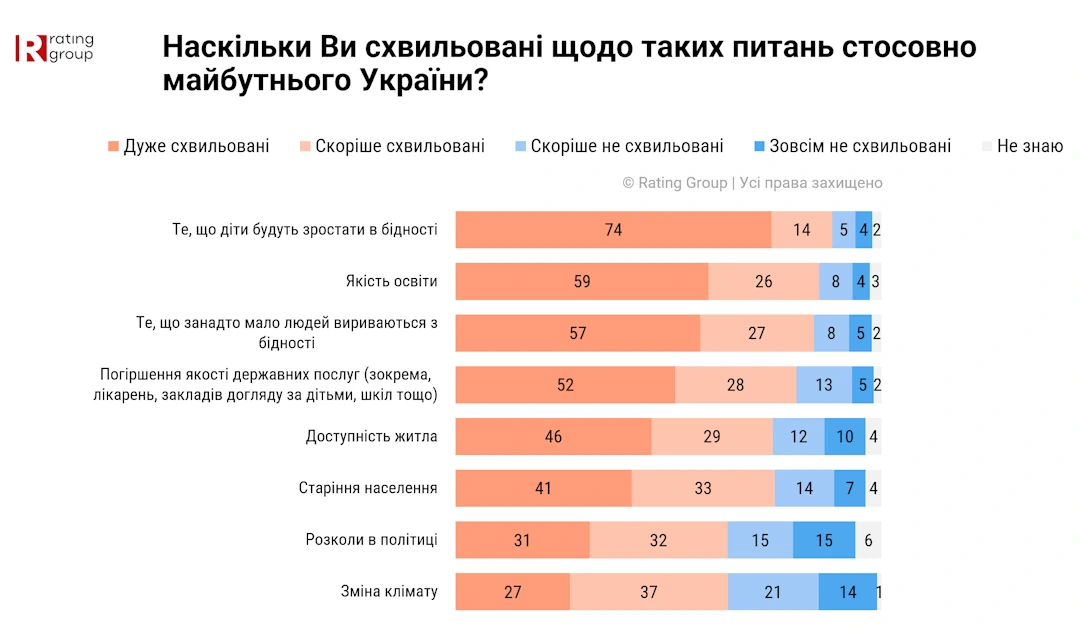
Amidst the war, Ukrainians are particularly concerned that children will grow up in poverty
All topics examined in the study concern the majority of Ukrainians to some extent. However, the level of concern varies significantly.
- Amidst the war, Ukrainians are most acutely aware of issues related to the future of children and their risk of growing up in poverty (88% are concerned, including 74% who are very concerned),
- The top three concerns also include the quality of education (85% overall and 59% very concerned) and poverty (84% overall and 57% very concerned).
- Climate and political divisions also significantly concern Ukrainians, but amidst the war, they are relatively less pressing than socio-economic and humanitarian issues.
- At a general level, the responses of Ukrainians are quite similar to the average indicators in EU countries. In some cases, the differences lie not so much in the overall percentage of people concerned about a particular issue, but in the intensity of this concern.
- Ukrainians are significantly more concerned about poverty, the quality of education, and population aging than the average EU citizen.
- In contrast, Ukrainians are somewhat less concerned about political divisions and climate change than the average in the EU.
Below, we will look at several topics in more detail.
The future of children is Ukrainians' most pressing concern regarding the country's future.
- 74% of Ukrainians are very concerned that children might grow up in poverty; overall, 88% are concerned.
- This is the highest concern level among all topics in the release.
- In Ukraine, this issue is significantly more acute than the EU average: 40% there are very concerned (compared to 74% in Ukraine).
Education is one of the key concerns in the context of the country's future.
- 59% of Ukrainians are very concerned about the quality of education; overall, 85% are concerned.
- This is the second most pressing issue after the risk of children growing up in poverty.
- The overall percentage of concern is close to the EU figure (85% in Ukraine, 81% on average in the EU), but again, there is a significant difference in the proportion of those who are very concerned: 59% in Ukraine and 39% in the EU.
Population aging: Amid war, migration, and human capital loss, concerns about the demographic situation are even more acute.
- 41% of Ukrainians are very concerned about population aging; overall, 74% are concerned.
- This topic concerns younger people relatively less than older citizens. While about two-thirds of young men and women express concern, 81% of men aged 51+ are concerned about population aging, and 87% of older women are concerned.
- Given the war, migration, human capital loss, and other challenges, concerns about population aging are significantly stronger in Ukraine than in the EU. While 26% in the EU are very concerned, this figure is 41% in Ukraine.
Ukrainians are often concerned about climate change, but urgent socio-economic and humanitarian challenges relatively shift this issue down in priority.

- 27% of Ukrainians are very concerned about climate change; overall, 64% are concerned.
- In Ukraine, women are relatively more concerned about climate change. Young men aged 18-35 showed the least concern about climate change (45% are concerned, 55% are not), whereas 68% of women in this age group are concerned.
- In many EU countries, the climate topic holds a more prominent place on the public agenda. On average, 78% of respondents in EU countries stated they are concerned about climate change.
Rating Group is one of Ukraine's largest research institutions, operating since 2008. The company is registered in Ukraine and has extensive experience conducting sociological surveys both within Ukraine and abroad. The group includes: Rating Sociological Group, Rating Lab research laboratory, Rating Online platform, and Rating Call Center.

Ahead of World Vyshyvanka Day 2026, we recall the results of sociological research on the affirmation of Ukrainian national and civic identity, conducted by the Sociological Group "Rating" (Rating Group) in September 2025 in cooperation with the Ministry of Youth and Sports of Ukraine.
Vyshyvanka remains an important cultural symbol for Ukrainians: 67% of Ukrainians own one.
- Residents of the West, women, and youth aged 14–19 are relatively more likely to report owning a vyshyvanka.
- Among those who own a vyshyvanka, 24% wear it often, 46% - sometimes. A third, however, rarely wear a vyshyvanka at all.
- We also asked Ukrainians to choose from a list of holidays that they have come to appreciate more over the past year / since the full-scale invasion. Vyshyvanka Day is among the top 5 such holidays – 17% mentioned it.
Rating Group is one of Ukraine's largest research institutions, operating in the market since 2008. The company is registered in Ukraine and has significant experience conducting sociological surveys both in Ukraine and abroad. The group includes: Sociological Group Rating, research laboratory Rating Lab, platform Rating Online, and Rating Call Center.

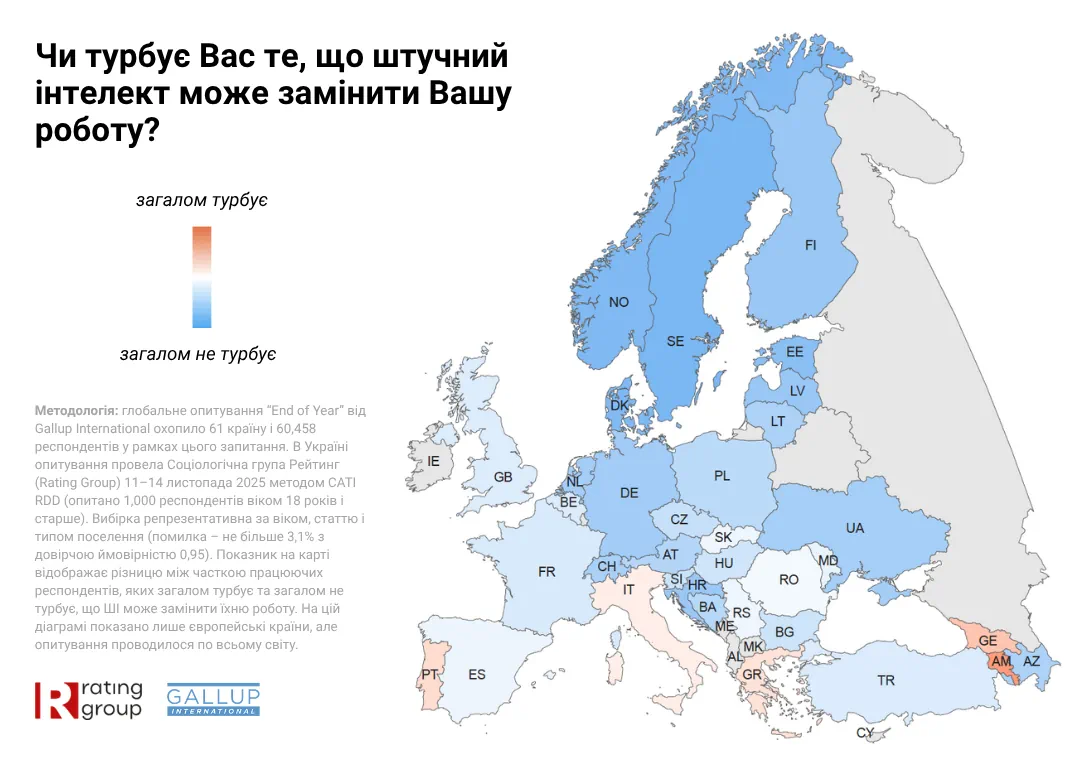
In issue #5 of the End of Year Survey, we discuss how concerned Ukrainians are that AI will replace their jobs.
We compare the data with public opinions in other European countries.
The End of Year Survey (EoY) is a global annual survey by the international sociological association Gallup International on the future, happiness, and expectations of populations in various countries. In 2025, over 60,000 respondents were surveyed in 61 countries worldwide. In Ukraine, the EoY survey has been conducted for the third consecutive year by the Sociological Group "Rating" (Rating Group).
Almost a third (30%) of employees in Ukraine are concerned that artificial intelligence will replace their jobs
- At the same time, another 69% of working individuals stated that they are not concerned about this.
- Employed citizens are relatively more concerned that AI will replace their jobs than self-employed individuals (32% compared to 19%).
- Self-employed citizens feel significantly calmer: 78% are generally not concerned, with 60% specifically stating that it does not concern them at all.
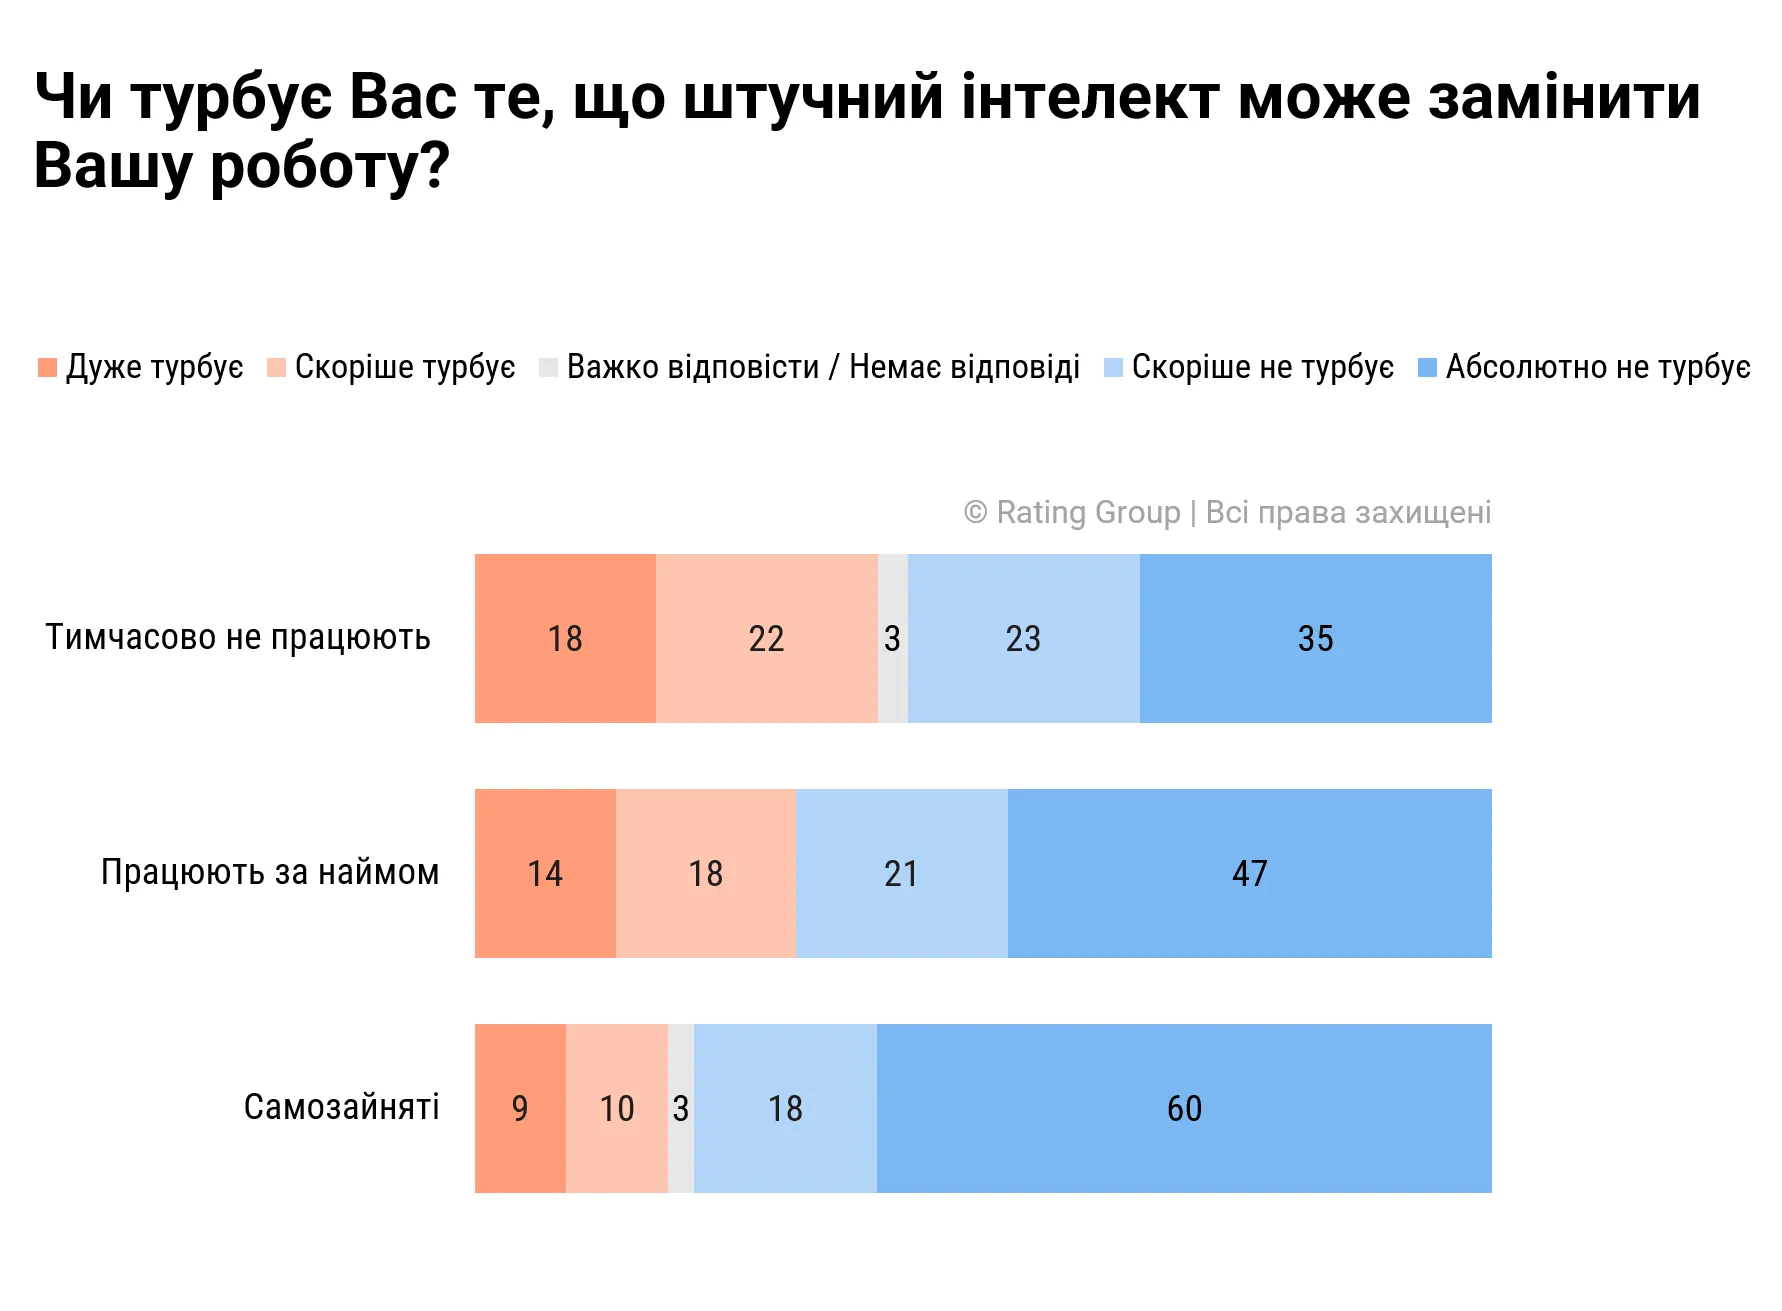
- The most concerned (40%) are, that AI will replace their jobs, are citizens who are currently temporarily out of work (unemployed / on parental leave / engaged in household duties*).
- Ukraine is among the top 10 European countries with the calmest perception regarding the scenario of AI replacing respondents' jobs (considering the balance between the proportion of working respondents who are concerned and those who are not). The top 10 countries for this indicator also include Nordic countries, Estonia, Latvia, Croatia, Germany, and the Netherlands.
*in the context of the survey, 'work' refers to 'professional employment', meaning it does not include unpaid reproductive labor, such as childcare, housework, etc.
Rating Group is one of Ukraine's largest research institutions, operating since 2008. The company is registered in Ukraine and has extensive experience conducting sociological surveys both in Ukraine and abroad. The group includes: Sociological Group Rating, Rating Lab research laboratory, Rating Online platform, and Rating Call Center.

For Mother's Day 2026 (May 10), the team of the Sociological Group Rating (Rating Group) asked Ukrainian mothers what it means for them to be a mother, what challenges they face, whether they have time for themselves, and if anyone helps them.
Being a mother means...
We asked the respondents to describe in their own words what being a mother personally means to them.
For mothers, motherhood is primarily love, care, tenderness, warmth, and a feeling of happiness. Many also mention that it means being a support and a friend to their child.

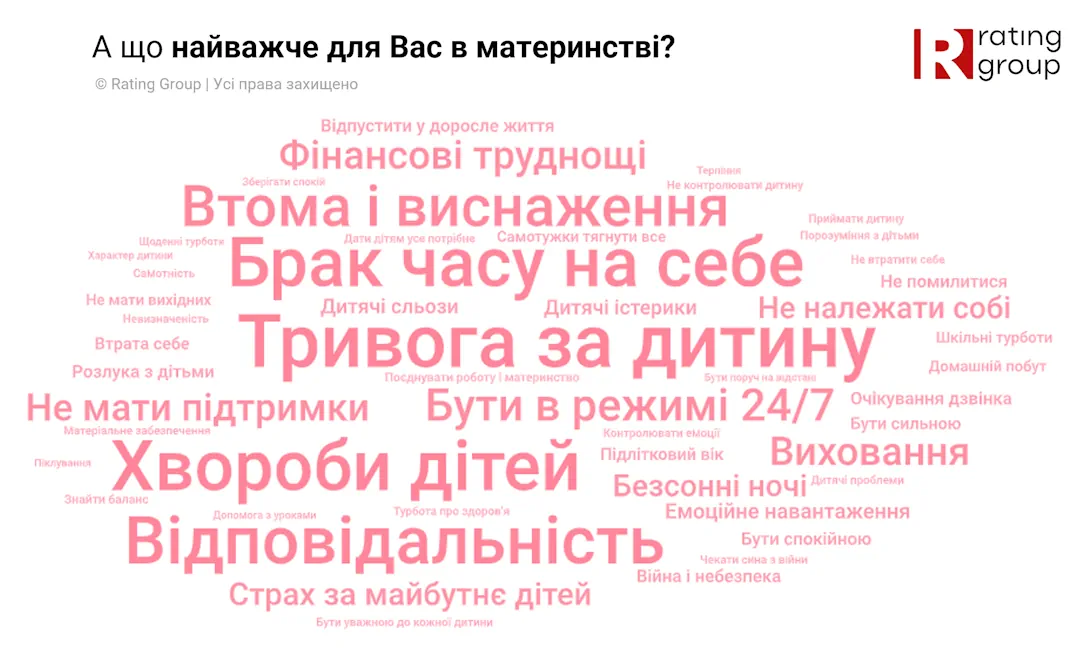
And what is the hardest part of motherhood?
Mothers say the hardest part is worrying about their child and their health, responsibility, lack of time for themselves, and the fatigue and exhaustion from being a 24/7 mom. And sometimes – a lack of support.
What do mothers feel?
We asked the respondents to assess their emotional state over the past month.
The most common feeling among Ukrainian mothers is anxiety (43%). Another 8% report fear.
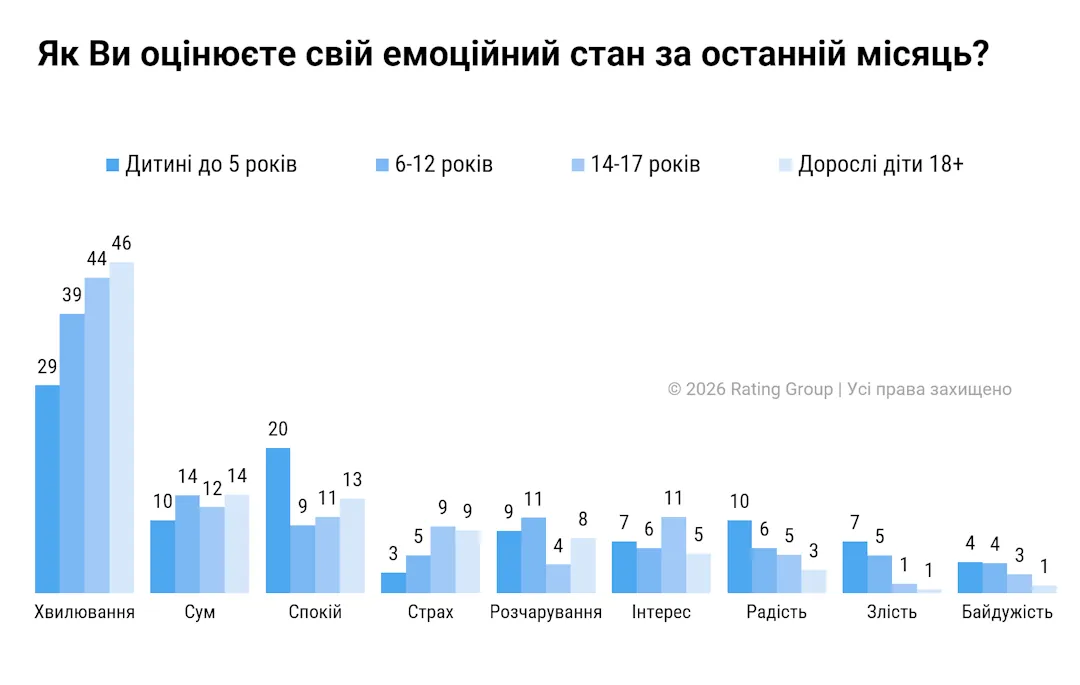
- In general, the older the child, the more often mothers feel anxious: 46% among mothers with adult children, compared to 29% among mothers of the youngest children (under 5 years old).
- Sadness is felt by 13% of mothers, while joy as a primary emotion is felt by only 5%. Mothers of children under 5 years old report joy relatively more often (10%).
- Calmness is felt by 13% of mothers. Mothers of children under 5 years old feel calm relatively more often: 20% (compared to 9-13% among mothers of children of other ages).
Time for themselves: what mothers (don't) manage to do?
Most mothers of children under 5 years old are unable to eat properly, rest, and do daily chores throughout the day:
- Approximately 65% of them cannot have breakfast and lunch every day. 57% cannot have a peaceful dinner.
- 64% of them cannot always take a shower/wash their hair when needed.
- 44% cannot even go to the toilet peacefully when needed.
What about time for rest?
- Approximately 35% of mothers of young children, 54-60% of mothers of school-aged children, and 72% of mothers whose children are adults have a relatively stable opportunity for rest. The rest do not have such an opportunity.
- Among mothers of preschoolers, one in four never or almost never has the opportunity to rest during the day (read a book, watch a movie, drink coffee, or just lie down). Only 7% of them have the opportunity to rest every day.
- Mothers of three or more children also rarely manage to rest.
At what age do mothers start getting enough sleep?
- Only about 10-15% of mothers of children under 18 get enough sleep every day or almost every day, whereas among mothers of adult children, this figure is already 30%.
- It is important to note that among mothers of preschoolers, almost 28% do not get enough sleep almost every day, and most of them sleep no more than 2-3-4 hours consecutively.
- Among mothers of school-aged children, about 40% also sleep poorly; however, a comparatively larger percentage among them get longer sleep of about 5-8 hours without waking up.
Help with the child
- Every second mother receives no help with her child/children, neither during the day nor in the evening. Every third mother receives no help even on weekends.
- In general, mothers receive support somewhat more often on weekends than on weekdays: primarily from their partner/husband (50%).
- The younger the child, the more support mothers receive from their partner and their parents. However, even among mothers of children under 5, one-third receive no help even in the evening.
- It is important that mothers of young children who receive no help with their children are significantly less likely to eat properly and do daily chores, especially regarding simple things like taking a shower or going to the toilet.
- Also, mothers who receive no help more often than others feel anxiety, sadness, indifference, and at the same time feel less joy.
Recovery
- It is important that the problem also includes the difficult process of postpartum recovery: almost every second mother needed more than 1-2 years to recover physically.
- Moral recovery is somewhat faster (from one month to six months), but not for everyone; at least one-third also needed a year or more to recover morally and psychologically.
- At the same time, with each subsequent child (for mothers having their second or third birth), recovery is a little faster, at least psychologically.
Rating Group is one of the largest research institutions in Ukraine, operating since 2008. The company is registered in Ukraine and has significant experience in conducting sociological surveys both in Ukraine and abroad. The group includes: Sociological Group Rating, Rating Lab research laboratory, Rating Online platform, and Rating Call Center.

For Europe Day 2026 (May 9) Sociological Group “Rating” (Rating Group) prepared the 4th issue of the study “Common Contours”. This time we compare:
- how Ukraine and other EU candidate countries perceive membership in the European Union;
- how Ukraine and the EU member states see the main values of the EU.
We would like to remind readers that Common Contours is a research series about Ukraine in a European context, where we mirror questions and compare data from our own surveys of Ukrainians with findings from surveys conducted in EU member states, candidate countries, and other European countries. In this edition, we compare the results of our survey with Eurobarometer data - the official EU survey series conducted by the European Commission and the European Parliament.
Note: Eurobarometer data belongs directly to the EU and we thank you for open access to it.
Is EU membership good or bad?
The vast majority of Ukrainians believe that Ukraine's accession to the EU would be a good thing. We are among the candidate countries with the most positive views on EU membership.
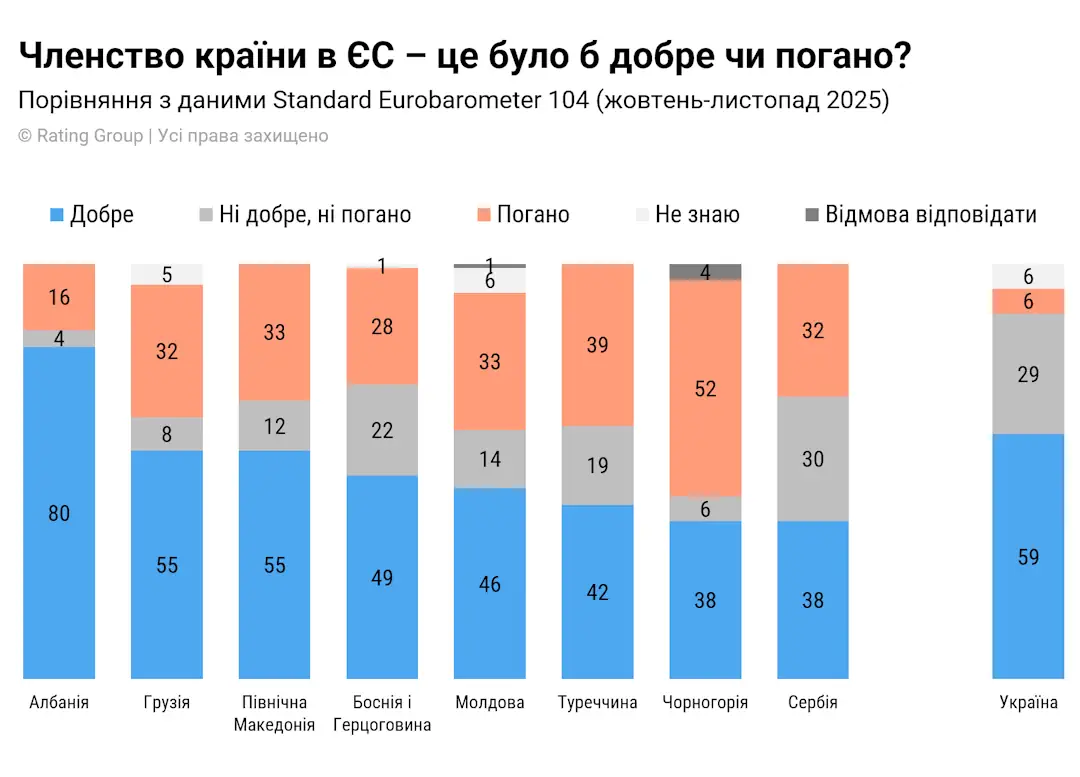
- In particular, 59% of respondents in Ukraine perceive EU membership positively, while 29% say it would be neither good nor bad. Only 6% express a negative opinion.
- Positive attitudes dominate across all macro-regions, with the highest level recorded in Kyiv (70%).
- Among EU candidate countries, the most positive attitudes toward EU membership are found in Albania (80% said EU membership would be a good thing) and Ukraine itself (59%).
- At the same time, Ukraine has the lowest share of direct negative assessments of EU membership among candidate countries. While this figure stands at 6% in Ukraine, it reaches 16% in Albania, 52% in Montenegro, and 33% in Moldova.
Would the country benefit from EU membership?
72% of Ukrainians are convinced that the country would benefit from EU membership
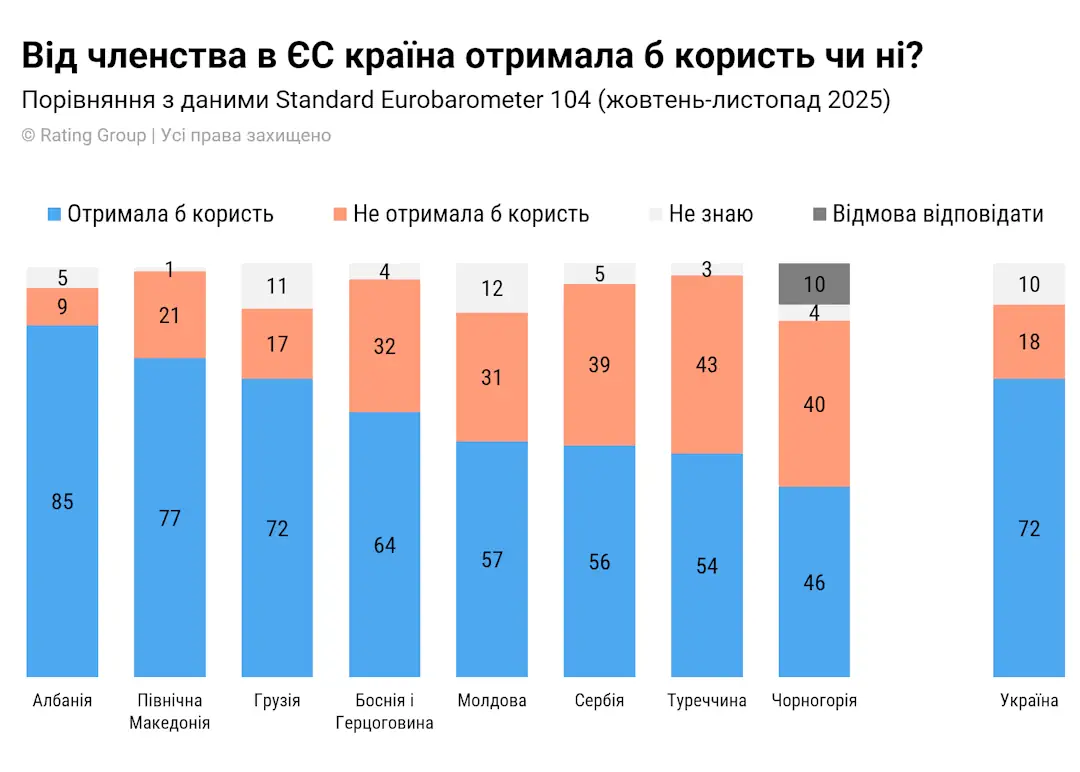
- Another 18% said there would be no benefit, and 10% said they did not know.
- Interestingly, even among opponents of joining the EU, almost one in five recognizes that membership in the European Union would be beneficial.
- Residents of Kyiv (80%) and the West (77%) speak about the benefits of membership relatively more often, but we also see a proportionately high rate among residents of other regions (Center - 71%, East - 68%, South - 67%).
- Among the candidate countries, Ukraine is among the most optimistic about the benefits of EU membership, along with Albania (85%), North Macedonia (77%) and Georgia (72%).
Perceptions of EU values
We asked respondents to choose from a list of values that they think best represent the European Union.
For Ukrainians, the values of the European Union are прежде всего peace, respect for human life, democracy, respect for rights, and the rule of law. Overall, Ukrainians’ perceptions of EU values are highly similar to views within EU member states themselves.
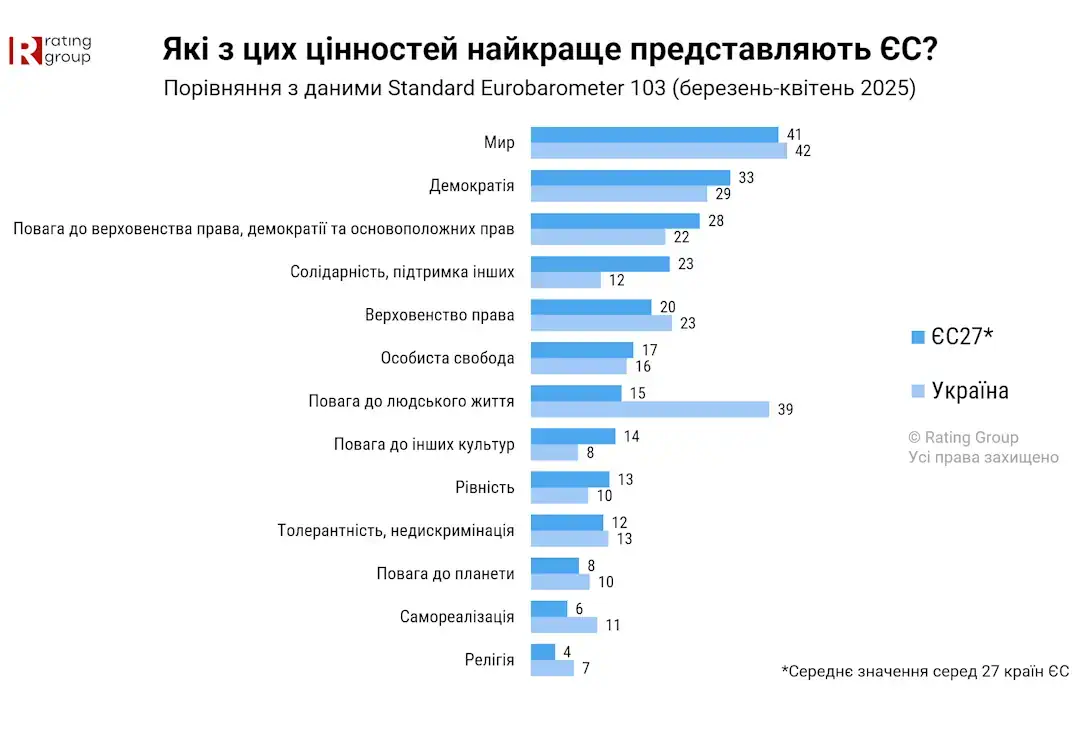
- Most often, Ukrainians mention peace (42%) and respect for human life (39%) as the key values of the EU.
- Ukrainians and EU citizens share similar perceptions of the EU as a space of peace-related values (42% in Ukraine and 41% on average across the EU), democracy (29% and 33%), respect for rights (22% and 28%), and the rule of law (23% and 20%).
- It is worth noting that, in the context of the full-scale invasion, Ukrainians mention respect for human life (39%) significantly more often than respondents in EU countries on average (15%).
- Compared to other key values, Ukrainians relatively less frequently selected solidarity and support for others (12%, compared to 23% in the EU average).
Below, take a look at what some of these expectations look like on the map.
Democracy
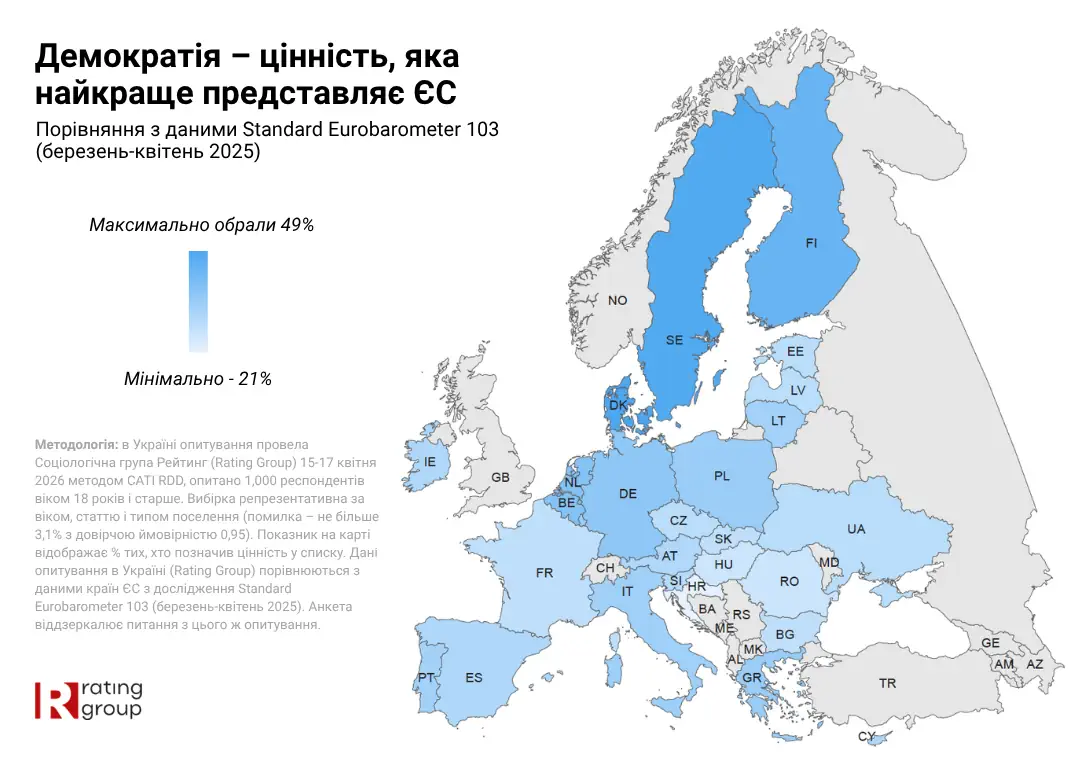
- Almost one third of Ukrainians (29%) selected democracy among the values that best represent the EU.
- By this indicator, Ukrainian public opinion generally follows the broader European trend, particularly the trend observed in Eastern European countries.
- A similar share selecting this answer option can be found in Latvia (29%), Estonia (29%), Slovakia (28%), and Bulgaria (28%). Comparable figures are also observed in several Western, Central, and Southern European countries, including France (28%), the Czech Republic (29%), and Spain (31%).
Respect for human life - expectations from Ukraine's European future?
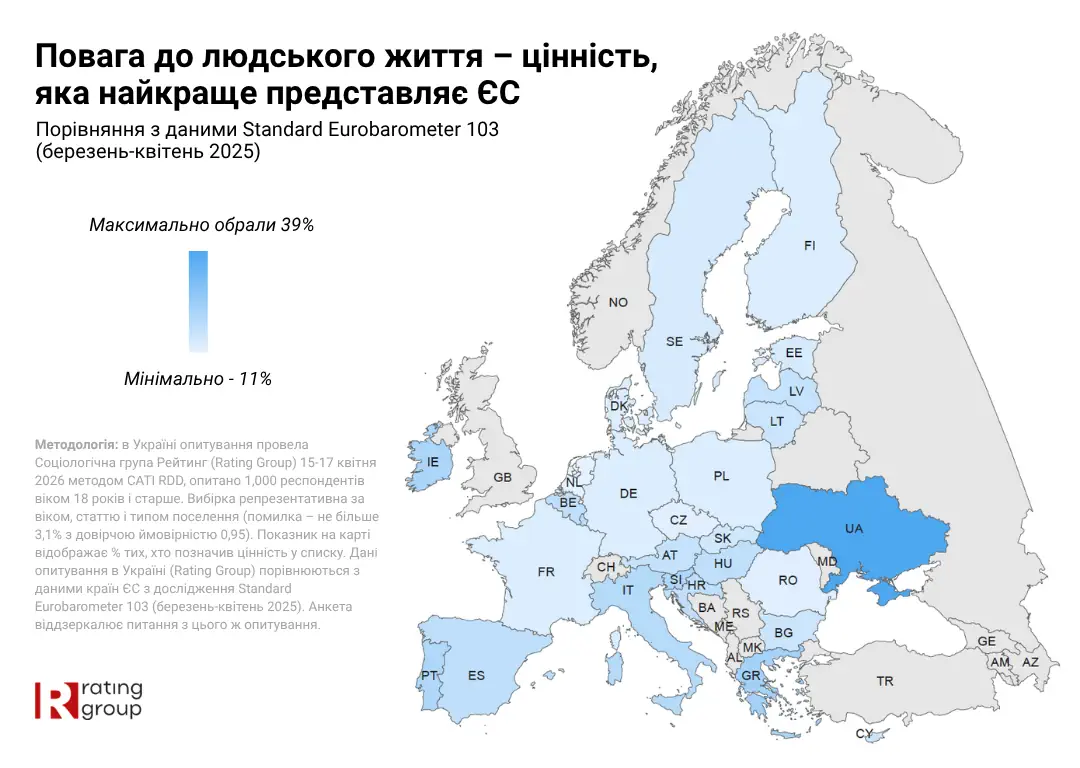
- Ukraine stands out significantly against the background of EU countries in the frequency of choosing respect for human life in the list of the main values of the EU.
- In the context of war, this indicates rather the desire for a peaceful and European future and security.
Rule of Law
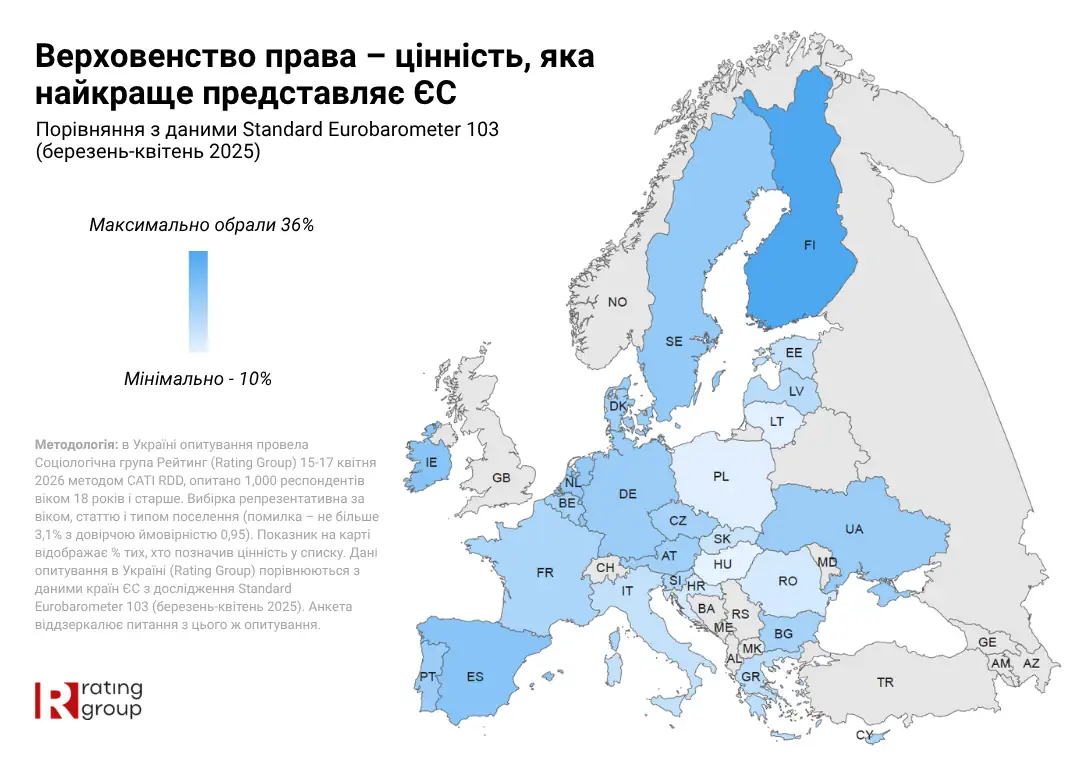
- Ukrainians and EU citizens share a very similar view on this value: 23% in Ukraine and 20% in the EU believe that the rule of law is best represented by the EU.
- The views of Ukrainians here are primarily similar to the opinions of the respondents of the Central European states.
- Ukrainians are more likely to speak of the rule of law as an EU value than our neighbours in Poland (11%), Romania (13%) or Slovakia (15%).
Rating Group is one of the largest research institutions in Ukraine, which has been on the market since 2008. The company is registered in Ukraine and has significant experience in conducting sociological surveys in Ukraine and abroad. The group includes: Sociological Group Rating, Research Lab Rating Lab, Rating Online platform and Rating Call Center.

The vast majority of Ukrainians (82%) believe that Ukraine will win the war
This is evidenced by the results of a new survey conducted by the Sociological Group "Rating" (Rating Group) in March 2026 for the Center for Analysis and Sociological Research (CISR) of the International Republican Institute (IRI) in Ukraine.
Survey topics:
- Assessment of the general situation
- Reconstruction of Ukraine
- Adaptation to wartime
- Attitudes towards elections during wartime
- Perceptions regarding the end of the war
- Other
The survey results are available in an interactive dashboard on the IRI website, as well as in the attached report.
Rating Group is one of Ukraine's largest research institutions, operating since 2008. The company is registered in Ukraine and has significant experience conducting sociological surveys both in Ukraine and abroad. The group includes: Sociological Group Rating, Rating Lab research laboratory, Rating Online platform, and Rating Call Center.

Within the framework of a new survey, the Sociological Group “Rating” (Rating Group) and research laboratory Rating Lab learned how the emotional state of Ukrainians has changed after the difficult winter of 2026.
Monitoring study of emotional state has been carried out since 2020 on the initiative of Rating Lab
General findings
The emotional state of Ukrainians is recovering after a difficult winter

- In April 2026, we see an improvement: the proportion of those who feel stressed has decreased to 39% (compared to 51% in February).
- Another 24% said they felt calmer rather, and 36% hesitated.
- Relatively more often, less affluent respondents, residents of the East, talk about tension. Among women, young people feel better, and older women aged 51+ are the most stressed. Among men, we do not fix a clear trend.
How has the emotional state of Ukrainians changed since 2020?

- Before a full-scale invasion. In 2020-2021, the emotional state of Ukrainians fluctuated. At the beginning of the COVID-19 pandemic, Ukrainians were still relatively more likely to feel calm (44%) than tense (23%). Later in 2020, tensions were felt markedly more (33%). At the same time, as of March 2021, the emotional state recovered somewhat: the relative majority felt calm (43%).
- Since the beginning of a full-scale invasion. At this time emotional state deteriorated sharply. About 50% of Ukrainians directly noted significant tensions in April 2022.
- After the successes of the Armed Forces at the front, the liberation of part of the territories, the emotional state began to improve moderately. As of February 2023, a year since the start of the full-scale war, a third of Ukrainians indicated that they feel tension, a third - that they feel calm.
- Winter 2026. During the difficult winter of 2026, in the face of massive Russian attacks on critical infrastructure, constant blackouts of light, heat, Ukrainians experienced the peak of emotional tension since 2020 (51%). This share exceeded even the figure of April 2022 (the first months of a full-scale invasion).
- Spring 2026. In April 2026 — with the onset of spring and the improvement of the situation in the energy system — the emotional state of Ukrainians improved rapidly. The proportion of those experiencing significant stress decreased by 12 percentage points.
Rating Group is one of the largest research institutions in Ukraine, which has been on the market since 2008. The company is registered in Ukraine and has significant experience in conducting sociological surveys in Ukraine and abroad. The group includes: Sociological Group Rating, Research Lab Rating Lab, Rating Online platform and Rating Call Center.

Rating Group, together with partners from the National Agency on Corruption Prevention (NACP) and the OSCE, conducted an expert survey “Corruption in Ukraine 2025: expert views and assessments.” The study is part of the project “Support to the development of effective tools for preventing corruption and strengthening anti-corruption compliance in Ukraine,” implemented by the OSCE Support Programme for Ukraine in cooperation with the NACP.
A total of 369 experts were surveyed:
- “Theorists” – analysts, independent experts/activists, NGO representatives, media, representatives of international organizations, academics
- “Practitioners” – representatives of anti-corruption bodies, the judiciary, the Verkhovna Rada/parliamentary oversight, ministries and other central executive authorities, regional state administrations, regional councils, and the Kyiv City Council
General assessments
- Corruption, especially political corruption, is seen as a serious challenge for Ukraine, although experts are generally optimistic about overcoming it.
- Political corruption is considered the most critical issue: 87% of experts assess it as a serious problem. Corruption in business is rated as such by 76%, while everyday corruption – by 43%.
- About two-thirds of experts (65%) believe corruption in Ukraine is widespread. The corruption perception index stands at 3.9 out of 5 and has not changed compared to 2023.
- 41% of experts see no change in the level of corruption over the past year, 33% say it has increased, and 21% say it has decreased.
- Expectations are generally optimistic: more than half of experts (53%) expect corruption levels to decline in the future, while 30% predict an increase.
Most and least corrupt sectors
Experts identify the most corrupt sectors (on a 1–5 scale, where “1” means no corruption and “5” means “very widespread”):
- customs (4.4)
- construction and infrastructure (4.3)
- security and defense (4.2)
The lowest levels of corruption, according to experts, are observed in foreign relations, digitalization, and statistics.
Assessment of anti-corruption policy
The effectiveness of state anti-corruption policy is assessed with caution.
Most often (45%), experts say that anti-corruption policy in Ukraine is sometimes effective and sometimes not. Another 28% consider it effective, while 23% say it is ineffective.
The overall effectiveness score is 3.1 out of 5 (compared to 3.0 in 2023). This is an average score based on a 5-point scale, where 1 means “completely ineffective” and 5 means “very effective.”
Anti-corruption policy priorities
Experts consider the following directions most effective for reducing corruption:
- automation of public services and business regulation (51%)
- ensuring inevitability of punishment (49%)
- judicial reform (37%)
- fostering zero tolerance for corruption, promoting integrity and respect for the rule of law (36%)
Assessment of anti-corruption institutions
Most experts consider the activities of National Anti-Corruption Bureau of Ukraine, Specialized Anti-Corruption Prosecutor's Office, High Anti-Corruption Court, and the National Agency on Corruption Prevention effective and largely independent.
These institutions remain leaders by average effectiveness score (1 = “completely ineffective,” 5 = “very effective”):
- NABU (3.8)
- SAPO (3.8)
- High Anti-Corruption Court (3.6)
- NACP (3.5)
More than half of experts rate these bodies as effective and consider them mostly independent. At the same time, other state institutions, particularly law enforcement agencies, receive significantly lower ratings.
Who is responsible for combating corruption?
Experts most often assign responsibility for combating corruption to the following institutions (up to three could be selected):
- NABU (45%)
- NACP (39%)
- Verkhovna Rada of Ukraine (34%)
- Office of the President of Ukraine (30%)
Compared to 2023, the perceived role of anti-corruption bodies has slightly increased, while the role of the President and the Presidential Office has decreased (from 43% to 30%).
Rating Group is one of the largest research institutions in Ukraine, operating since 2008. The company is registered in Ukraine and has extensive experience conducting sociological research both domestically and internationally. The group includes: Sociological Group “Rating,” the research laboratory Rating Lab, the platform Rating Online, and the Rating Call Center.

The topic of Issue No. 4 of the End of Year Survey is how Ukrainians perceive the demographic situation in the country:
- how to assess the demographic situation in the country as a whole;
- how many children do they think should be in the family.
We compare the data with public views in other European countries.
The End of Year Survey (EoY) is a global annual survey by the international sociological association Gallup International on the future, happiness and expectations of the population of different countries. In 2025, more than 60,000 respondents were surveyed in 61 countries of the world. In Ukraine, the EoY survey is conducted for the third year in a row by the Sociological Group “Rating” (Rating Group).
Assessment of the demographic situation
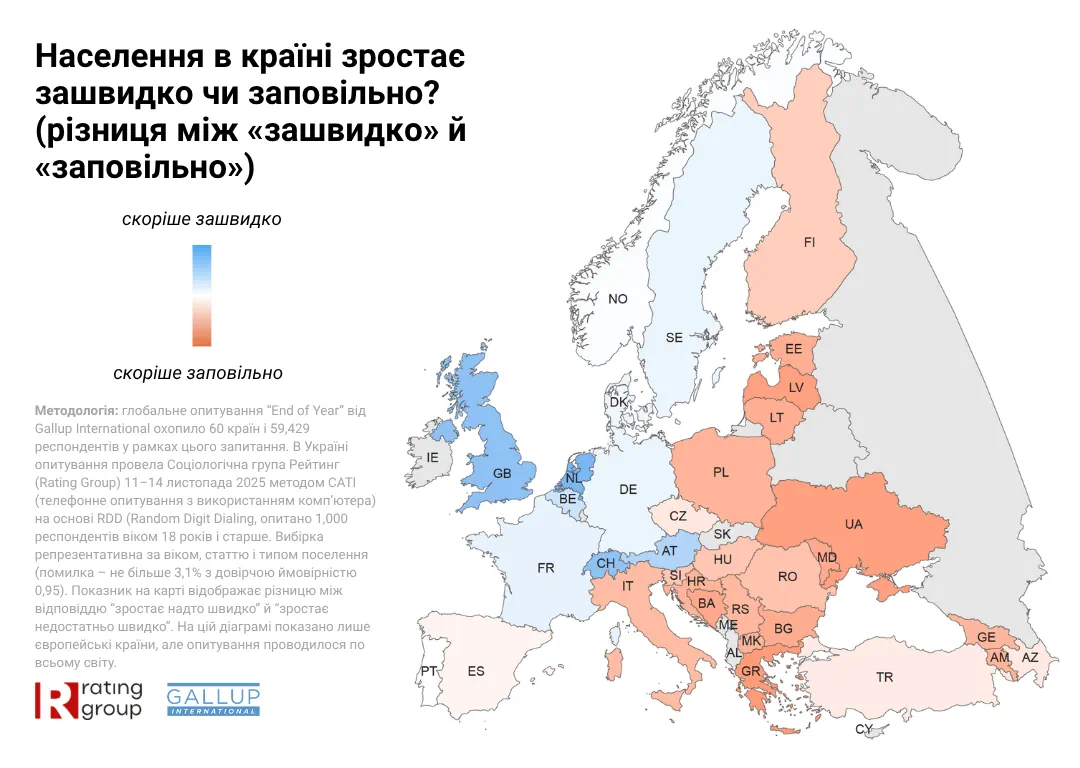
Ukraine ranks second in Europe on concerns about slow population growth
- The vast majority of Ukrainians (88%) believe that the population of the country is not growing fast enough. Only 5% rate the pace as optimal, and 1% as too high.
- According to the share of responses about too slow population growth, Ukraine shares the second place in the world with Latvia (there is also 88% of the opinion). An even greater share of concern in this context is in Greece.
How many children should be in the family?
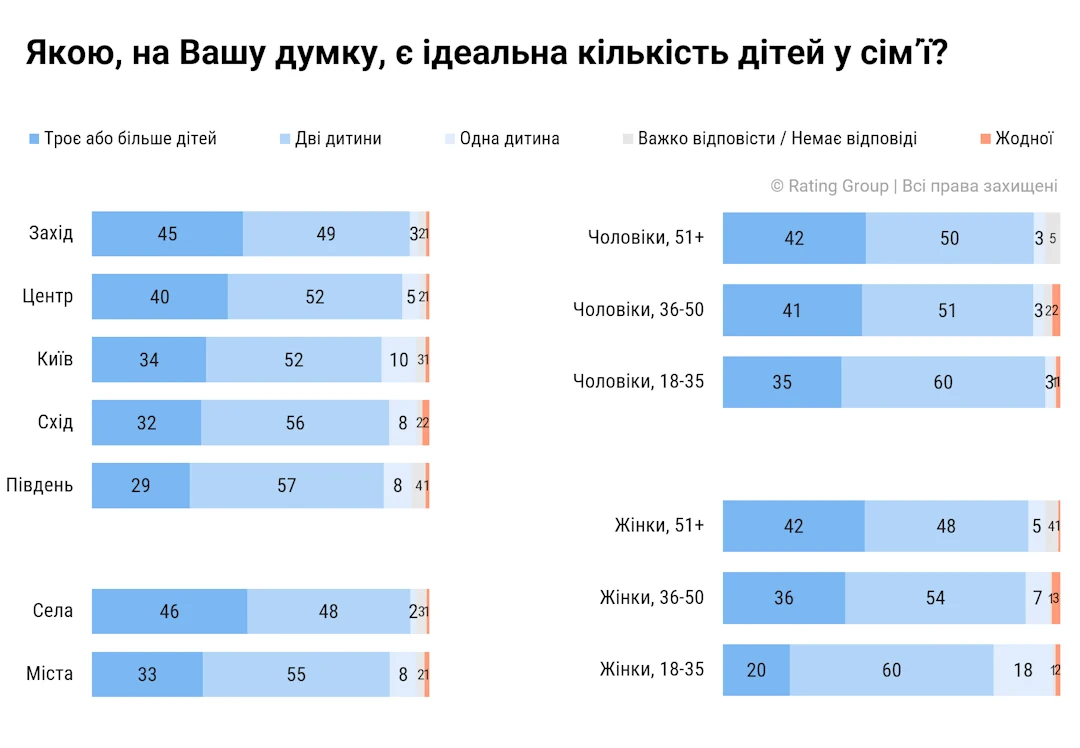
Ukrainians most approve of the family model when there are 2-3 children or more. This resonates with a general concern about population size.
- Most Ukrainians consider a family with two children to be the best model (53%), while 37% believe that it is worth having three or more children. The proportion of those who talk about one child or say that ideally it is possible not to have children at all (“childfree”) is low (6% and 1%, respectively).
- In all socio-demographic categories, the opinion prevails that it is best to have two children. About what it is worth having three or more children relatively Older respondents aged 51+, residents of the West (45%) and the Center (40%) of the country, as well as in rural areas (46%) speak more often.
- Among young people aged 18-35, the model of the family with two children is particularly supported (60% in the responses of both men and women).
- Young men want more children than women. A third of young men (35%) express the opinion that it is worth having three or more children, and among young women this proportion is 20%. For their part, young women are more likely than young men to support the option when there is one child (18% compared to 3%). Such a significant difference between men and women is not observed in other age categories.
- In general, the views of Ukrainians are comparable to the global average trend (54% - for the model of a family with two children, 27% - with three and more).
- In addition, Ukraine is among the top 10 countries in Europe in terms of the frequency of choice of 3+ children (the same list includes, for example, Armenia, Georgia, Moldova, Estonia, Latvia). This is again an indicator that Ukrainians are very concerned about the demographic situation.
Note: this question shows the views of the respondents, but does not indicate the actual number of children in their family
Rating Group is one of the largest research institutions in Ukraine, which has been on the market since 2008. The company is registered in Ukraine and has significant experience in conducting sociological surveys in Ukraine and abroad. The group includes: Sociological Group Rating, Research Lab Rating Lab, Rating Online platform and Rating Call Center.

Rating Group (Sociological Group “Rating”) conducted a unique cross-audit study on breastfeeding. We wanted to know how Ukrainian mothers, women, doctors relate to breastfeeding and what experience they have.
To do this, we interviewed three audiences:
- 970 mothers of children aged 0 to 2 years (in particular, 450 — mothers of children aged 0-6 months and 520 — mothers of children aged 6 months to 2 years)
- 792 other women (including women with older children, grandmothers of babies, women without children)
- 220 pediatricians and family doctors who work with children from birth
The authors of the study: Tetiana Skrypchenko, Deputy Director of Rating Group (mother of Solomiia, 1 year old); Marianna Tkalych, CEO of Rating Lab, Doctor of Psychological Sciences (mother of Masha, 17 years old); Anna Makhnitska, breastfeeding and infant sleep consultant, USCARA member, mother of 6 children.
The study was funded by Rating Group.
Important: the study is prepared in order to reflect the views, assessments, opinions, experiences of citizens of Ukraine. The results of the study are not medical advice.
How common is breastfeeding?
Almost 60% of babies from 0 to 6 months are breastfed. Instead, 28% — have artificial feeding (formula), another 14% — on mixed (both formula and breastfeeding at the same time).
Note: the method of primary feeding of the child was studied, additional exclusive feeding (without supplementation or complementary feeding) was not studied.
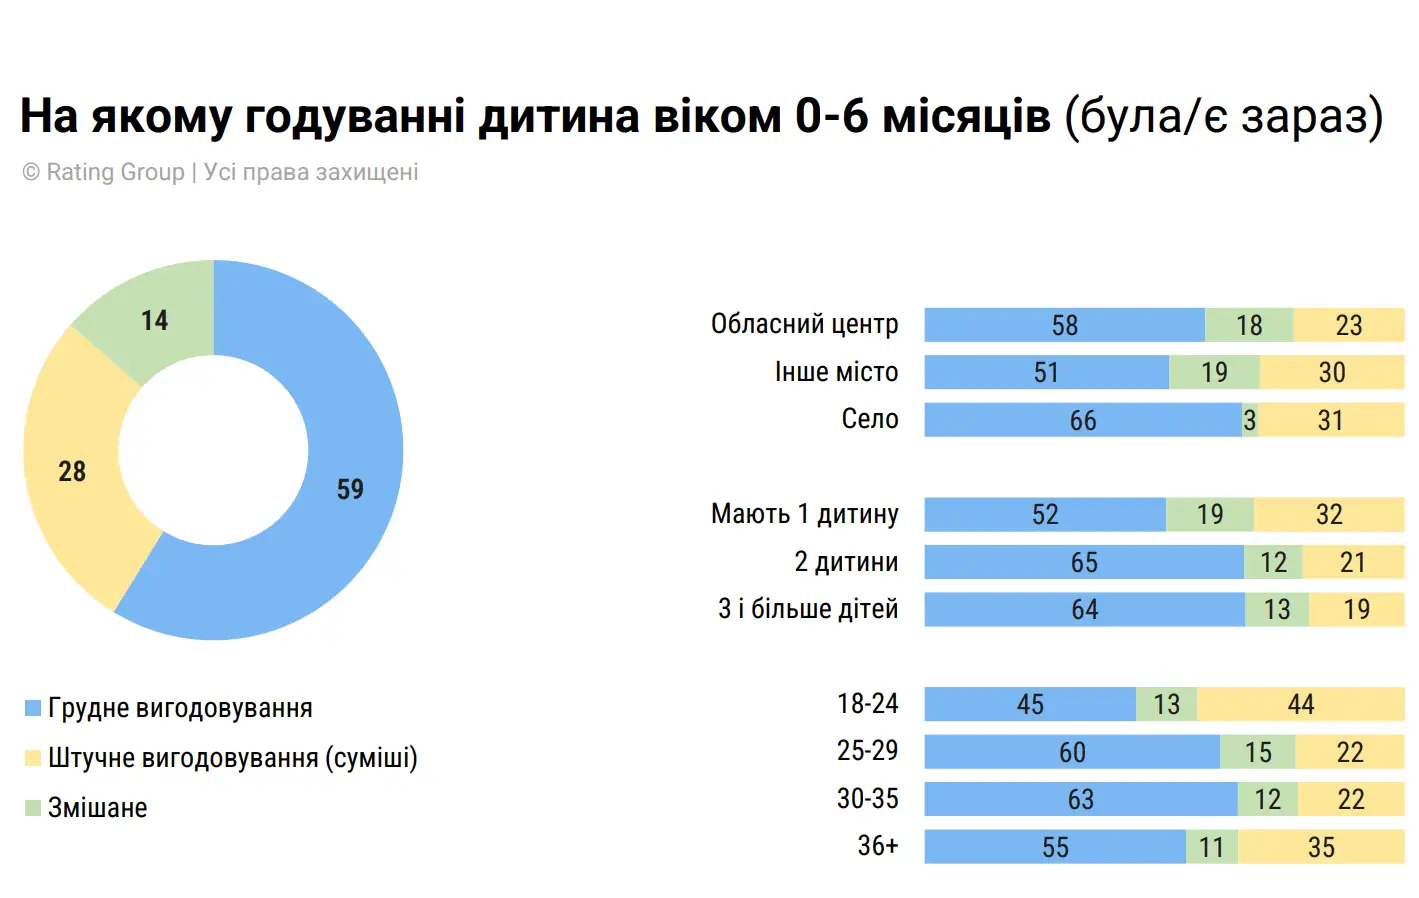
- The lowest percentage of BF — among young mothers aged 18-24 (45%) and women who are first-time mothers (52%). AF is also more common in villages (66%) and regional centers (58%) than in small towns (51%). The financial situation of the family has no connection with the level of BF.
- Most children who were on mixed feeding up to 6 months, after half a year completely switch to artificial feeding.
- 91% of mothers on BF feed their baby on demand. Among those who are mixed, on demand, 71% feed, those who are fully on mixtures - 59% (others feed on schedule).
- Mixed-fed babies are significantly more likely to use the dummy (45% — constantly use) than those on mixed (18% use constantly) or exclusively on BF (11% constantly use).
Feeding ideas
We asked respondents to rate which feeding — breastfed or artificial — was better according to various criteria.
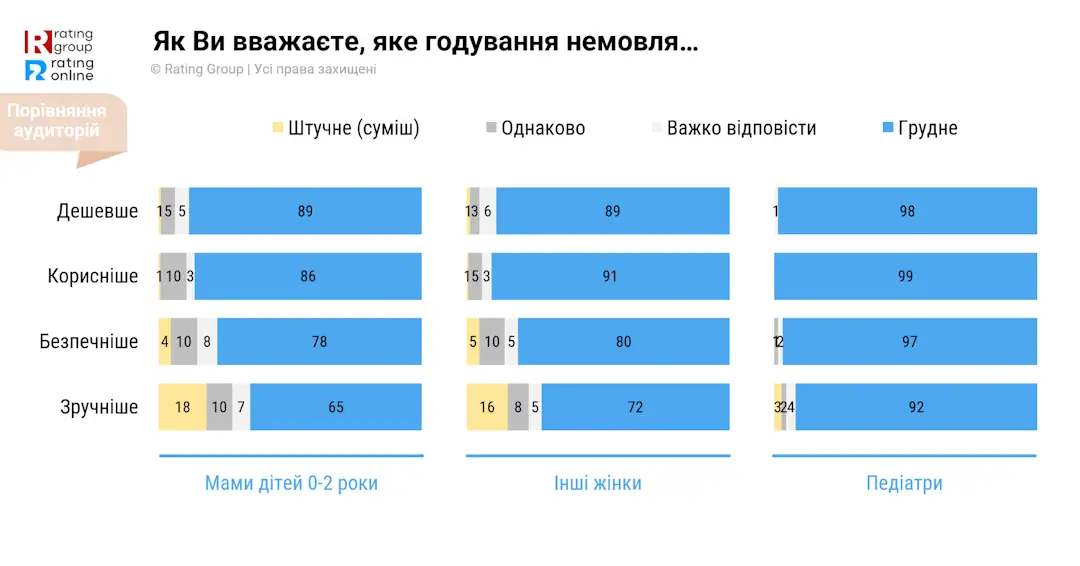
Among all audiences, the idea prevails, that breastfeeding is a cheaper, healthier and safer feeding option than a mixture.
At the same time, opinions are divided on convenience. In particular, for mothers on suture mixtures seem more convenient than breastfeeding.
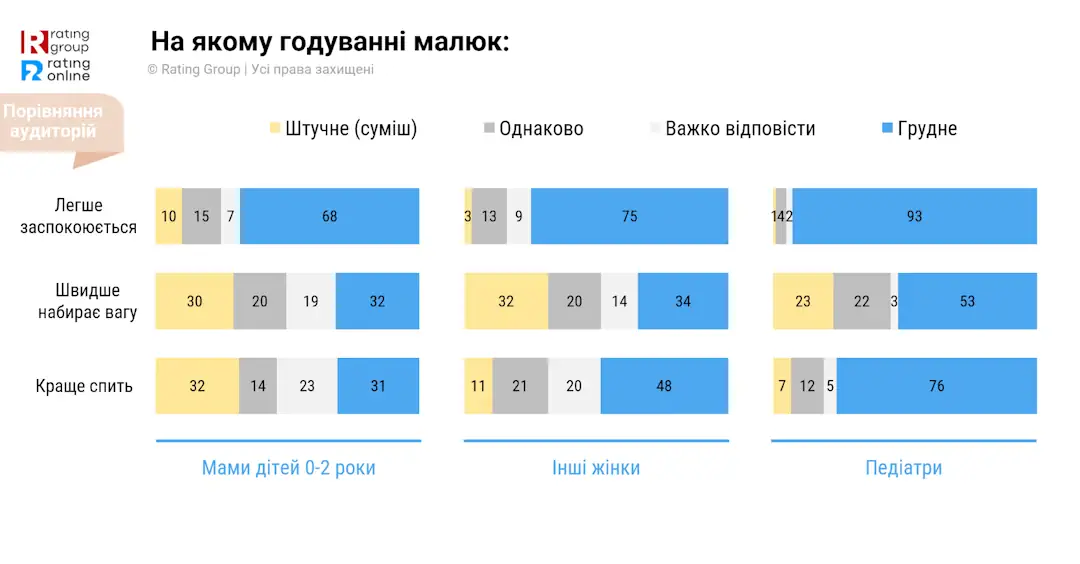
- On what feeding the baby calms down more easily: most believe that on BF (68%). The exception is mothers on AF, who in this matter often do not see the differences between AF and BF.
- On what feeding the baby gains weight faster: here half of the other women, and even almost half of the doctors answered that the child can gain faster on mixtures or that there is no difference between the mixture and BF in terms of weight gain. In part, even the mothers on BF also agreed with this.
- When the child sleeps better? Among mothers who are on AF or mixed feeding, half answered that they sleep better on the mixture, the rest opted for the option that it is the same or that they do not know. Even mothers with BF doubt this question: at least a quarter of them believe that the baby can sleep better on the mixture, most of them also could not answer.
- If compare expressed breast milk and formula, the majority of respondents clearly prefer breast milk from both mothers (77%) and other women (76%) and doctors (99%). At the same time, for mothers whose baby is on formula, the advantage of expressed milk is not obvious, almost half of them believe that the mixture is the best option (46%).
- Against this background, an option milk from a can of breast milk looks less familiar and understandable to respondents. In this comparison, the mixture is perceived as more familiar. For mothers on BF, milk from a can of breast milk is still better than a mixture, but for mothers on mixed - 50 to 50. And according to moms on the mix, the mixture is definitely the best alternative to milk from a can of breast milk.
Stereotypes, myths, public pressure regarding breastfeeding
Stereotyping support

A block of statements about breastfeeding shows that anti-BF myths are not dominant, but noticeably present. Doctors mostly disagreed with all the statements, however, among other women, many myths are partly widespread.
“If the child gains little weight, you need necessarilytop up with a mixture”
This thesis received the most agreement: about 40% among mothers, almost 60% among other women and about 20% among doctors.
“If the baby talks/walks, it's time to complete breastfeeding”
A third of mothers, almost half of other women and about 20% of doctors agreed.
“If the baby often cries and asks to eat, it means that the mother's milk is not nutritious”
This is what 23% of mothers and almost 40% of other women believe.
“After 1 year, there is no benefit in breast milk”
20% of mothers and 25% of other women agreed.
“Long breastfeeding makes the baby too spoiled”
17% of mothers and 25% of other women agree.
“A breastfeeding mother should definitely follow a diet”
This is the statement where we see the greatest gap between the responses of mothers and other women. Among mothers, this is the least popular myth, but among other women, almost half are sure of it.
Differences by groups:
- Moms who are on BF, for the most part did not agree with any statement. In contrast, women on mixed or mixtures were significantly more likely to share such views.
- For example, with the statement “if the child gains little weight, it is necessary to supplement with a mixture” 60% of mothers on a mixture or mixed agree, while among mothers on BF - only 28%.
- “If the baby often cries and asks to eat, it means that the mother's milk is not nutritious” - also half of the mothers on the formula and a third of the mothers on the mixed one are convinced of this, while the mothers on the BF did not agree with this.
- Regarding other audiences of women: in general, all stereotypes are more common among grandmothers who have young grandchildren and may be trying to transmit these ideas to their children. Also, stereotypes are more common among women who do not have children at all.
- For example, if mothers do not agree that it is necessary to follow a diet on BF, then among grandmothers almost 50% are sure that a diet must be. The same proportion agreed with the statement among women without children. In general, among these two categories, there is also the most negative attitude towards long-term breastfeeding.
BF in 1-2 years: supported or condemned?
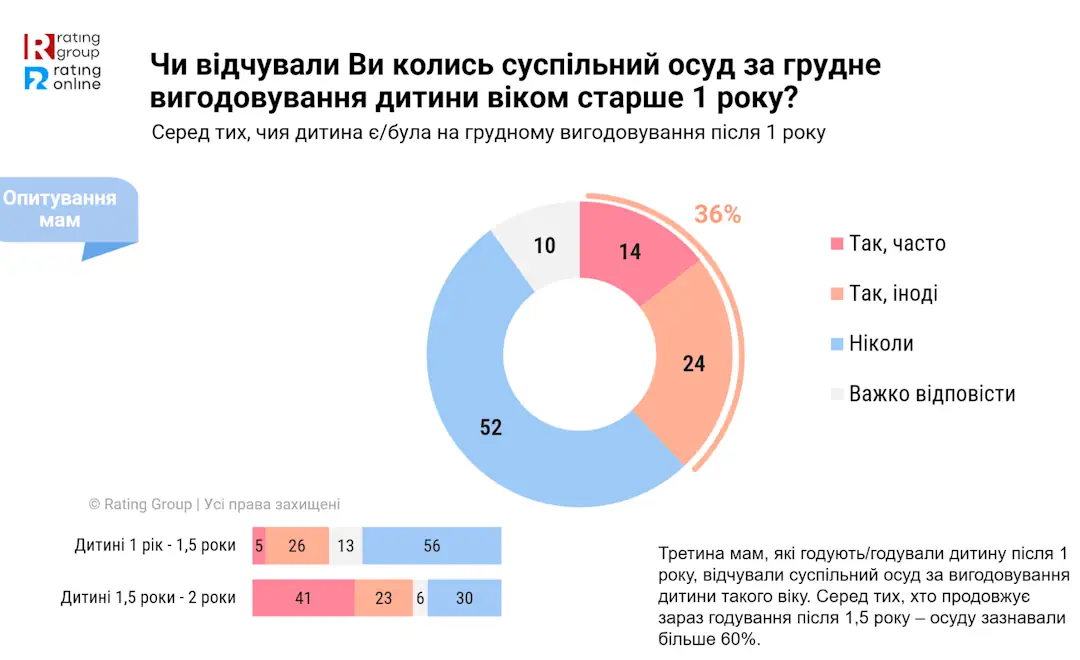
- Among mothers whose child was or is breastfed after 1 year, 36% felt public condemnation for it. And the longer they continue, the more condemnation they feel: for example, among those who continue feeding after 1.5 years, more than 60% have already experienced condemnation.
- Among the residents villages every fourth mother who breastfeeds after a year often faces condemnation for prolonged BF.
- The assessment of the normality of breastfeeding of a child aged 2 years, differs significantly between audiences .For mothers who are on BF, this is rather normal, especially among those who continue it on their own, but for mothers on mixed and mixed — it is rather not normal.
- Grandmothers of babies and women without children are the worst at breastfeeding at 2 years old.
- Among doctors, breastfeeding of a child aged 2 years is considered normal by almost 80%. A more positive attitude is among doctors who are guided by international recommendations or have passed a certification course on BF.
Attitude to breastfeeding in public places
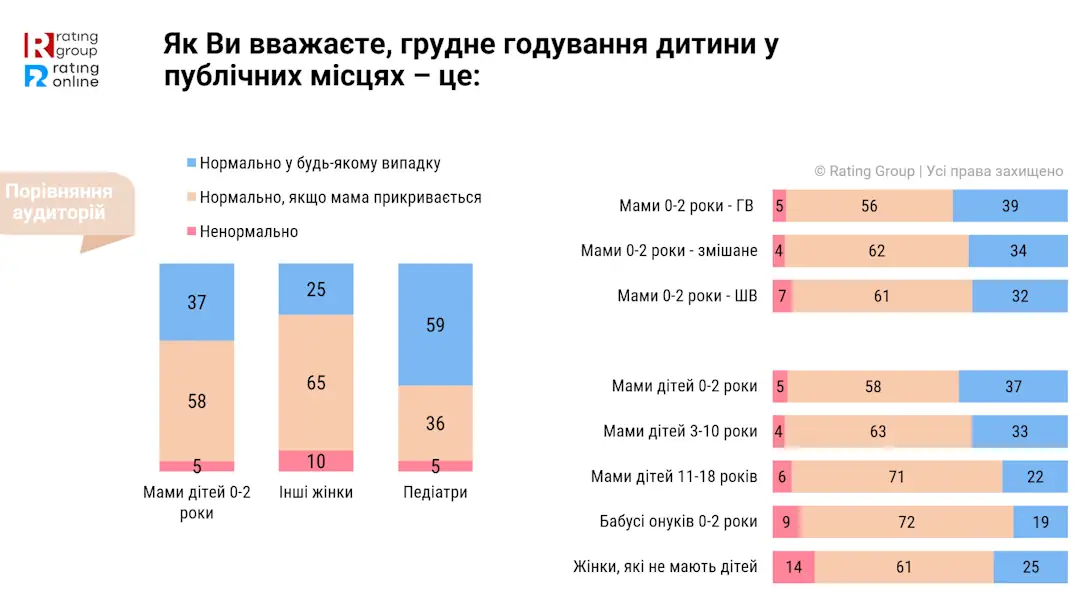
The attitude towards breastfeeding in public places is generally more acceptable, but with many “buts” — conditional, “if I don't see it”.
- Other women, including mothers, believe that breastfeeding in public places is normal, provided that the mother “covers up”. Moms who are themselves on BF are somewhat more loyal to this, but the difference is small.
- Grandmothers and women without children are most critical of this.
These trends are confirmed by our experiment. We told the respondents an imaginary situation about a mother who needs to feed her child in a public place. Then the respondents were asked to evaluate what the mother should do in this situation:
a) feed the baby here
whether b) look for another place to feed/return home?
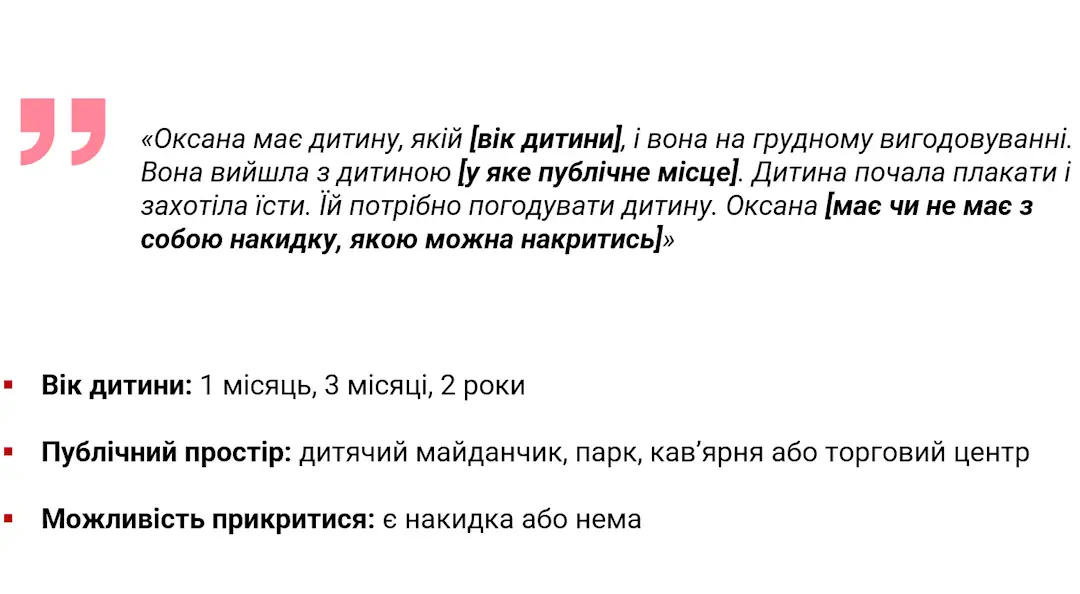
Factors that varied in situations: age of the child; place (playground, coffee shop, park, shopping center); presence or absence of a cape.
According to the results of the experiment:
- The factor of having a cape with which you can “cover up” is very influential: in its absence, among mothers, 24% advise the imaginary mother to go home, if there is a cloak - only 9%. Among other women, in the absence of mention of a cape, 42% are advised to go home, while if there is a cape, twice as much (23%).
- Among mothers there are no significant differences in location, but for other women it matters: most often they do not want to see a nursing mother in a coffee shop, restaurant. Also, mothers of older children do not really want to see a nursing mother on the playground. Relatively better attitude — if it is a park or shopping center. At the same time, if there is a cape, the impact of the feeding site is significantly reduced.
- The age of the child also matters for other women: for example About 40% of one- to two-year-old children believe that their mother should feed at home, while with a baby of several months it is less likely to be “sent home” (about 20%).
- In general, in the eyes of society, the most “comfortable” situation for feeding is when the baby is still small (3 months), there is a cape and this is, for example, a park.
- And the most stigmatized situation is if the mother is in a coffee shop and without a cape. In general, even here, most mothers themselves are ready to support breastfeeding, but not the rest of the population.
- Of course, mothers with their own experience of long-term HB (especially those who now continue to breastfeed) are the least critical of HB in public places in any situation.
Therefore, normalizing BF in public places is very important, including the attitude that “this is normal regardless of location”, “the cape may be an option but not a requirement”, and “even older children can be breastfed outside the home without shame”.
Combining BF with an active life
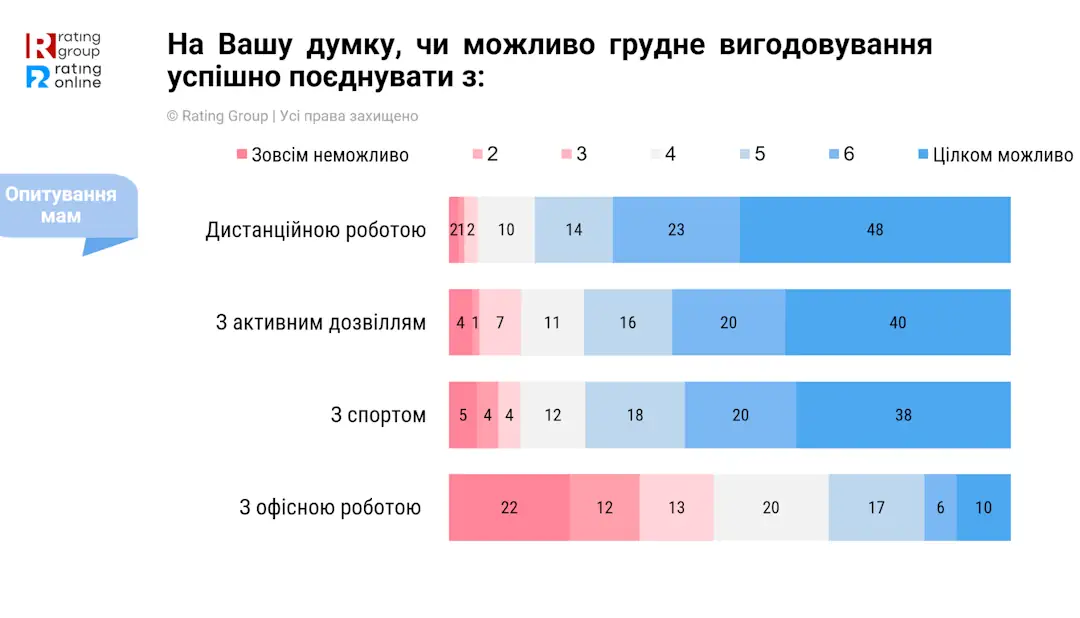
Moms mostly agree that breastfeeding can be successfully combined with leisure, sports and remote work, although mothers with BF have much more confidence in this.
- About 40% of breastfeeding mothers believe that feeding can even be combined with office work, while among mothers who use formula this share is twice as low. Breastfeeding mothers who already have part-time or hybrid work are the most confident that this is possible.
- Overall, the employment rate of mothers does not depend on the type of feeding their child receives: around 45% of surveyed mothers with children aged 0–2 are currently working full-time or part-time, and this показатель is almost the same across different feeding types. Mothers who practice mixed feeding are relatively more likely to have office-based jobs.
- Among women with office or semi-office work formats, about half report having the opportunity to breastfeed at work (availability of a mother-and-child room or a flexible schedule). However, among formula-feeding mothers working in offices, the majority indicate that they do not have such an opportunity.
Feeding experience
Help with feeding
- 65% received assistance from maternity staff in setting up BF, 27% - did not receive.
- 42% received advice on breastfeeding outside the maternity hospital: among them 40% — from a private consultant (more often in large cities); 35% from a family doctor; 34% — consulted with relatives (more often in villages); 18% - a public nurse.
- 72% felt support from loved ones, relatives in the process of establishing breastfeeding. The most important thing for them was the support of the husband— 55%, already in second place — parents (23%), sisters (7%). 18% did not feel support from relatives.
Having support is very important to establish breastfeeding
Breastfeeding rate depending on the availability of support:
- Among those who had skin-to-skin contact within the first hour after birth, the breastfeeding rate is 65% (vs. 49% among those who did not).
- Among those who received help from maternity staff, the breastfeeding rate is 66% (vs. 54% among those who did not receive help).
- Among those who felt support from relatives: 67% (vs. 48% among those without such support).
- Among those primarily supported by partners: 69% (vs. 56% among those supported by parents).
Feeding difficulties
- In general, the main challenges related to breastfeeding were experienced both by mothers who switched to formula and those who continued breastfeeding. These include physical pain, improper latch, emotional fatigue, and overall physical exhaustion.
- Mothers who switched to formula after the first month more often report emotional exhaustion, stress, and inability to constantly stay with the child.
- Regarding personal comfort, breastfeeding mothers were most concerned about milk leakage (37%), inconvenience of feeding outside the home (31%), and the need to constantly be with the child (26%).
- Around 20% were also concerned about milk let-down (sweating), inconvenience of night feedings, the need for special clothing, and the baby scratching during feeding.
- Diet, body changes, or breast sensitivity were less significant concerns for breastfeeding mothers. However, among those who switched to formula by personal choice, concerns about diet and body shape were more prominent.
Completion of feeding
- Nearly 60% stop breastfeeding before the child reaches 1.5 years (among those who breastfed). About a quarter stop between 1.5 and 1 year 11 months. Only 17% continue until age 2 or later.
- Mothers who stopped breastfeeding before 1.5 years often mention night feedings and sleep deprivation as the biggest difficulties. They also more frequently report emotional fatigue.
- Overall, reasons for stopping before age 2 include personal choice, discomfort, and exhaustion. Less frequently mentioned are the child refusing or being “old enough” (usually referring to children older than 1.5 years).
- Among those who stopped before one year, key reasons also include personal discomfort and the desire for the child to be more independent.
Switching to formula
- 42% started using formula from the first days in the maternity hospital, and another 40% did so within the first three months.
- 79% described the decision to switch to formula as forced, while 14% said it was their personal choice. However, 53% made the decision independently, while only 36% did so on the advice of a pediatrician (12% on advice from others). Those who followed medical advice more often mention concerns about the child’s weight.
- The main reasons for switching to formula were the feeling that the child is hungry (40%) and insufficient milk supply (40%). Secondary reasons include latch problems, concerns about weight gain, emotional exhaustion, and stress. Medical contraindications are rarely cited.
- At the same time, pediatricians note that, alongside lack of milk, a common reason is also the mother’s personal choice.
- For working mothers, in addition to insufficient lactation, returning to work and inability to stay constantly with the child is also a reason.
- Mothers who switched by personal choice cite personal discomfort, emotional exhaustion, and physical pain during feeding. Difficulties feeding outside the home are among the main limitations. They are also more concerned about milk leakage, attachment to the child, and dietary restrictions.
Doctors’ survey – breastfeeding practices
- 43% of doctors (family doctors and pediatricians working with newborns) frequently encounter cases where infants switch to formula within the first 6 months. This is reported more often by doctors in public practice.
- 21% of doctors rely on national guidelines for introducing formula, 34% on international recommendations, and 41% make decisions individually. Younger doctors and those in private practice are more likely to follow international recommendations.
- 24% of doctors have completed certification courses on lactation, 51% attended short trainings, and 52% studied independently. Full certification is more common among doctors in regional centers, younger doctors, and pediatricians.
- One in ten doctors considers breastfeeding a two-year-old child abnormal. 57% say it is completely normal, 21% rather normal, 11% undecided, and 12% rather abnormal.
- The more knowledgeable doctors are about breastfeeding, the more positively they assess feeding up to two years (73% “completely normal” among those with certification vs. 47% among those self-taught). Doctors who follow international guidelines are also more likely to consider it normal (65% vs. 44% among those using national protocols).
- 52% of doctors recommend breastfeeding for at least 2 years (40% up to 2 years, 12% up to 3 years). 42% recommend shorter durations. Doctors with lactation training more often recommend breastfeeding for at least 2 years.
- When parents consider switching to formula, about half of doctors insist on maintaining breastfeeding, while the other half suggest continuing but also provide guidance on formula. Older and more experienced doctors are more likely to insist on maintaining breastfeeding.
- Doctors generally recommend switching to formula in cases of medical contraindications or insufficient weight gain (around 60%). Secondary reasons (around 40%) include insufficient milk supply or inability of the mother to stay constantly with the child. Less frequently (10–15%) they recommend switching due to latch problems or breast pain.
When the mother complains of insufficient milk:
- most doctors (80-90%) observe the weight gain of the child, ask about attachment and feeding regimen, attachment technique;
- 75% also observe the further behavior of the child and the frequency of feedings;
- 58% examine the mother at the reception;
- 19% refer their mother to a lactation consultation.
Doctors with lactation training are more likely to examine mothers and refer them to specialists. More experienced doctors also tend to conduct such examinations more often.
About Family 360° technology
The Rating Group team launched the technology Family 360° for family surveys, where the child and his environment are in the center, a survey is conducted by parents, family members, in some cases - teachers, doctors, psychologists, etc. In this study, the focus was on interviewing mothers of babies, as well as their environment, including pediatricians.
The Rating Group is one of the largest research institutions in Ukraine, which has been on the market since 2008. The company is registered in Ukraine and has significant experience in conducting sociological surveys in Ukraine and abroad. The group includes: Sociological Group Rating, Research Lab Rating Lab, Rating Online platform and Rating Call Center.

In the third issue of “Common Contours,” we compare how gender (in)equality is perceived in Ukraine and the EU.
We asked respondents to assess who is treated better in Ukraine across different areas of life: men, women, or everyone equally. The areas include
- healthcare institutions,
- educational institutions (schools, universities),
- mass media,
- the workplace,
- advertising,
- politics.
We remind you that “Common Contours” is a survey exploring Ukraine in a European context, where we mirror questions and compare data from our own surveys of Ukrainians with data from other surveys conducted in EU countries, candidate countries, and other European countries. In this issue, we compare data from our own research with Eurobarometer data — a series of official EU surveys conducted by the European Commission and the European Parliament.
Note: Eurobarometer data belongs directly to the EU, and we are grateful for open access to it.
Perceptions of gender (in)equality

- Equality is most visible in healthcare institutions, educational institutions, and the media (around 70% of respondents said that men and women are treated equally in these areas).
- A majority also believe that equality exists in the workplace (62%) and in advertising (57%).
- At the same time, respondents perceive the greatest inequality in politics: slightly more than one-third report equal treatment, while nearly half (47%) say that men are treated better in politics. In this context, there are also notable differences in responses between men and women.
When comparing perceptions of who is treated better in society:
- women are perceived to be treated relatively better in advertising (26% vs. 5% who say men are treated better), in schools and universities (17% vs. 8%), and in healthcare institutions (14% vs. 10%).
- men are more often seen as receiving better treatment in politics (47% say men are favored vs. only 6% for women) and, to some extent, in the workplace (17% vs. 14%).
Comparison between Ukraine and EU countries
- Ukrainians and respondents from the 27 EU countries share a high level of optimism regarding equality in healthcare and education: around 70% in both Ukraine and the EU on average say that men and women are treated equally in these areas. Similarly, in both Ukraine and the EU, more than half of respondents report equal treatment in advertising.
- At the same time, Ukrainians are significantly more optimistic about equality in the workplace and in the media. For example, in Ukraine, nearly two-thirds of respondents say that men and women are treated equally at work, whereas in EU countries this view is held by about 40% on average (and around half of respondents in the EU believe that men are treated better at work).
- As for politics, views in Ukraine and the EU are fairly similar. In both cases, more than one-third of respondents report equality, but more often respondents point to an advantage for men (47% in Ukraine and 54% in EU countries).
Breakdown by sectors
Healthcare institutions
- 70% of Ukrainians believe that men and women are treated equally in healthcare institutions, while 14% report a preference in favor of women.
- Men are noticeably more likely than women to say that women are treated better in healthcare. For example, one in five men aged 36–50 holds this view, compared to one in ten women in the same age group.
- Ukraine’s indicators are close to the EU average: the share of those who report equal treatment is nearly identical (around 70%). At the same time, Ukrainians are more likely than the EU average to report a preference for women (14% vs. 9% in the EU) and less likely to report better treatment of men (10% vs. 19%).
Schools and universities
- Nearly 70% of respondents in Ukraine say that men and women are treated equally in educational institutions. 17% report better treatment of women, while 8% say men are treated better.
- In this context, women are more likely than men to say that treatment is equal. Men are significantly more likely than women to report that women are treated better in education. For example, among men aged 18–35, 29% say that women are treated better in educational institutions, compared to 9% of women in the same age group. Similarly, 29% of men aged 36–50 share this view, compared to 14% of women in that age group.
- Ukraine’s indicators are similar to those of the EU: the share reporting equal treatment is nearly the same (around two-thirds). However, Ukrainians are more likely to report better treatment of women in education (17% vs. 9% in the EU) and less likely to report better treatment of men (8% vs. 20% in the EU).
Media
- In the context of media, 68% of respondents in Ukraine say that men and women are treated equally. Another 13% report more positive treatment of women, while 11% say men are treated better.
- There are no major differences between how men and women respond to this question overall. However, some differences appear in the older age group (51+): men are more likely to report better treatment of women (17% vs. 7% among women), while women are more likely to report better treatment of men (17% vs. 6% among men).
- Ukrainians assess equality in the media more optimistically than respondents in EU countries on average. While about two-thirds in Ukraine report equal treatment, this figure is 54% in the EU. In addition, 11% in Ukraine say men are treated better, compared to an EU average of 31% — nearly three times higher.
Workplace
- Two-thirds of Ukrainians believe that men and women are treated equally at work (62%). 17% say that men are treated better, while 14% believe that women receive better treatment in this sphere.
- The largest differences in responses are observed among younger respondents (aged 18–35). Young men and women tend to report preferences in favor of each other. For example, among young men, 23% believe that women are treated better at work (compared to 5% of women in the same age group). Among young women, in turn, 23% say that men are treated better (compared to 12% of young men).
- In Ukraine, significantly more respondents report equality at work than in EU countries (62% vs. 40%). Conversely, in EU countries, respondents are much more likely to say that men are favored in the workplace (51% vs. 17% in Ukraine) and less likely to report better treatment of women (6% vs. 14% in Ukraine).
Advertising
- Regarding advertising, 57% of respondents in Ukraine say that men and women are treated equally. A quarter of respondents (26%) report better treatment of women, while only 5% believe that men are treated better. Notably, 12% answered “don’t know.”
- The largest differences in responses are observed between men and women aged 36–50. Among men in this group, 45% say treatment is equal, while nearly the same share (44%) say women are treated better. In contrast, women aged 36–50 mostly report equal treatment (66%), with 16% noting better treatment of women.
- In the context of advertising, Ukrainians again report equal treatment more often than respondents in the EU on average (68% vs. 54%). Meanwhile, in the EU, respondents are three times more likely than in Ukraine to say that men are treated better in advertising (31% vs. 11% in Ukraine).
Politics
- Around one-third of Ukrainians (37%) believe that men and women are treated equally in politics. However, a relative majority (47%) say that men are treated better. Only 6% report better treatment of women, while another 10% are undecided.
- While men and women in other age groups show relatively similar response patterns, significant differences appear among younger respondents (aged 18–35). Among young women, only one-third believe that treatment is equal, while a majority (61%) say that men are favored. Young men see the situation differently: half (52%) report equal treatment, while 40% say men are favored.
- Assessments in Ukraine and the EU are broadly similar on this issue: in both cases, about one-third report equal treatment, while 47% in Ukraine and 54% in the EU on average say that men are treated better.
Rating Group is one of the largest research institutions in Ukraine, operating since 2008. The company is registered in Ukraine and has extensive experience in conducting sociological surveys both domestically and internationally. The group includes: Sociological Group Rating, the research laboratory Rating Lab, the platform Rating Online, and the Rating Call Center.

To what extent are Ukrainian youth involved in volunteering and public activity in general? What areas are she most interested in and what are the barriers to participation?
Fall 2025 Rating Group (Sociological group “Rating”) asked about this more than 2 thousand Ukrainians aged 14-35 in Ukraine (as well as 600 representatives of Ukrainian youth in the countries of the European Union). Below are key findings in the context of civic participation of young people in Ukraine.
These findings are part of a large combined study “Impact of War on Youth in Ukraine 2025”, conducted by the Rating Group on the initiative of the Ministry of Youth and Sports of Ukraine and the support of the United Nations Development Programme (UNDP) in Ukraine and the Government of Denmark. The research project demonstrates how Ukrainian youth feel and change during a full-scale war.
Level of involvement in volunteering

- More than half of young people in Ukraine have experience of volunteering during a full-scale invasion (53%): 27% volunteered before the full-scale invasion and continued after it, while 26% joined just after February 24, 2022.
- Most often, young people in Ukraine who have volunteered are involved on their own initiative (55%), through relatives, friends and acquaintances (42%) or through an educational institution (11%).
- We also asked young people who not are engaged in volunteering, about barriers to participation. Most often in the list denote lack of free time (56%), skills and experience (24%) information (14%), interest or motivation (13%), and in some cases distrust of initiatives (8%).
The level of involvement in public activity
- The vast majority of young people in Ukraine (about 80%) trust public and volunteer associations. At the same time, the indicator of personal participation in civil society institutions is divided roughly in half: 48% of young people directly noted that they had not participated in the last 12 months at the time of the survey.
- 21% of young people participated in school or student self-government, 13-15% - in sports or volunteer organizations, about 10% - in educational, cultural, scientific or charitable organizations.
- 8% of young people said they would most like to work in the public sector.
- Three quarters of young respondents (77%) are ready to participate in community recovery processes. However, more than half (54%) do not feel able to personally influence changes in the community, 44% do.
- Most often, young people who do not feel the levers of influence in the life of the community explain this by lack of knowledge and experience (33%), the idea that their opinion will not change anything (30%), a lack of understanding of how they can influence (30%), lack of visible examples of positive change (16%), distrust of decision-making processes (14%).
Youth centers
- A relative majority of young people in Ukraine state that there is a youth center in their community (45%), whereas a third say that there is no such center in the community, and another 19% answered “it is difficult to answer”.
- Among those young people who noted the presence of a youth center in the community, 17% visit the centers once a month or more often.
- In general, almost half of young people visit youth centers at least occasionally.
Areas of activity of interest to young people

- The most interest among young people is the participation formats related to development and gaining new experiences: for example, traineeships (27%) and youth exchanges within Ukraine (25%).
- In addition, 20% of young people are interested in art and cultural projects, 18% - public events (festivals, forums), 18 - educational events (trainings, etc.), 16% - discussion clubs and debates.
Rating Group is one of the largest research institutions in Ukraine, which has been on the market since 2008. The company is registered in Ukraine and has significant experience in conducting sociological surveys in Ukraine and abroad. The group includes: Sociological Group Rating, Research Lab Rating Lab, Rating Online platform and Rating Call Center.